 Engineering
·
Data Science
Iris - Turning observations into actionable insights for enhanced decision making
Introduction
| Iris (/ˈaɪrɪs/), a name inspired by the Olympian mythological figure who personified the rainbow and served as the messenger of the gods, is a comprehensive observability platform for Extract, Transform, Load (ETL) jobs. Just as the mythological Iris connected the gods to humanity, our Iris platform bridges the gap between raw data and meaningful insights, serving the needs of data-driven organisations. Specialising in meticulous monitoring and tracking of Spark and Presto jobs, Iris stands as a transformative tool for peak observability and effective decision-making. |

|
- Iris captures critical job metrics right at the Java Virtual Machine (JVM) level, including but not limited to runtime, CPU and memory utilisation rates, garbage collection statistics, stage and task execution details, and much more.
- Iris not only regularly records these metrics but also supports real-time monitoring and offline analytics of metrics in the data lake. This gives you multi-faceted control and insights into the operational aspects of your workloads.
- Iris gives you an overview of your jobs, predicts if your jobs are over or under-provisioned, and provides suggestions on how to optimise resource usage and save costs.
Understanding the needs
When examining ETL job monitoring across various platforms, a common deficiency became apparent. Existing tools could only provide CPU and memory usage data at the instance level, where an instance could refer to an EC2 unit or a Kubernetes pod with resources bound to the container level.
However, this CPU and memory usage data included usage from the operating system and other background tasks, making it difficult to isolate usage specific to Spark jobs (JVM level). A sizeable fraction of resource consumption, thus, could not be attributed directly to our ETL jobs. This lack of granularity posed significant challenges when trying to perform effective resource optimisation for individual jobs.
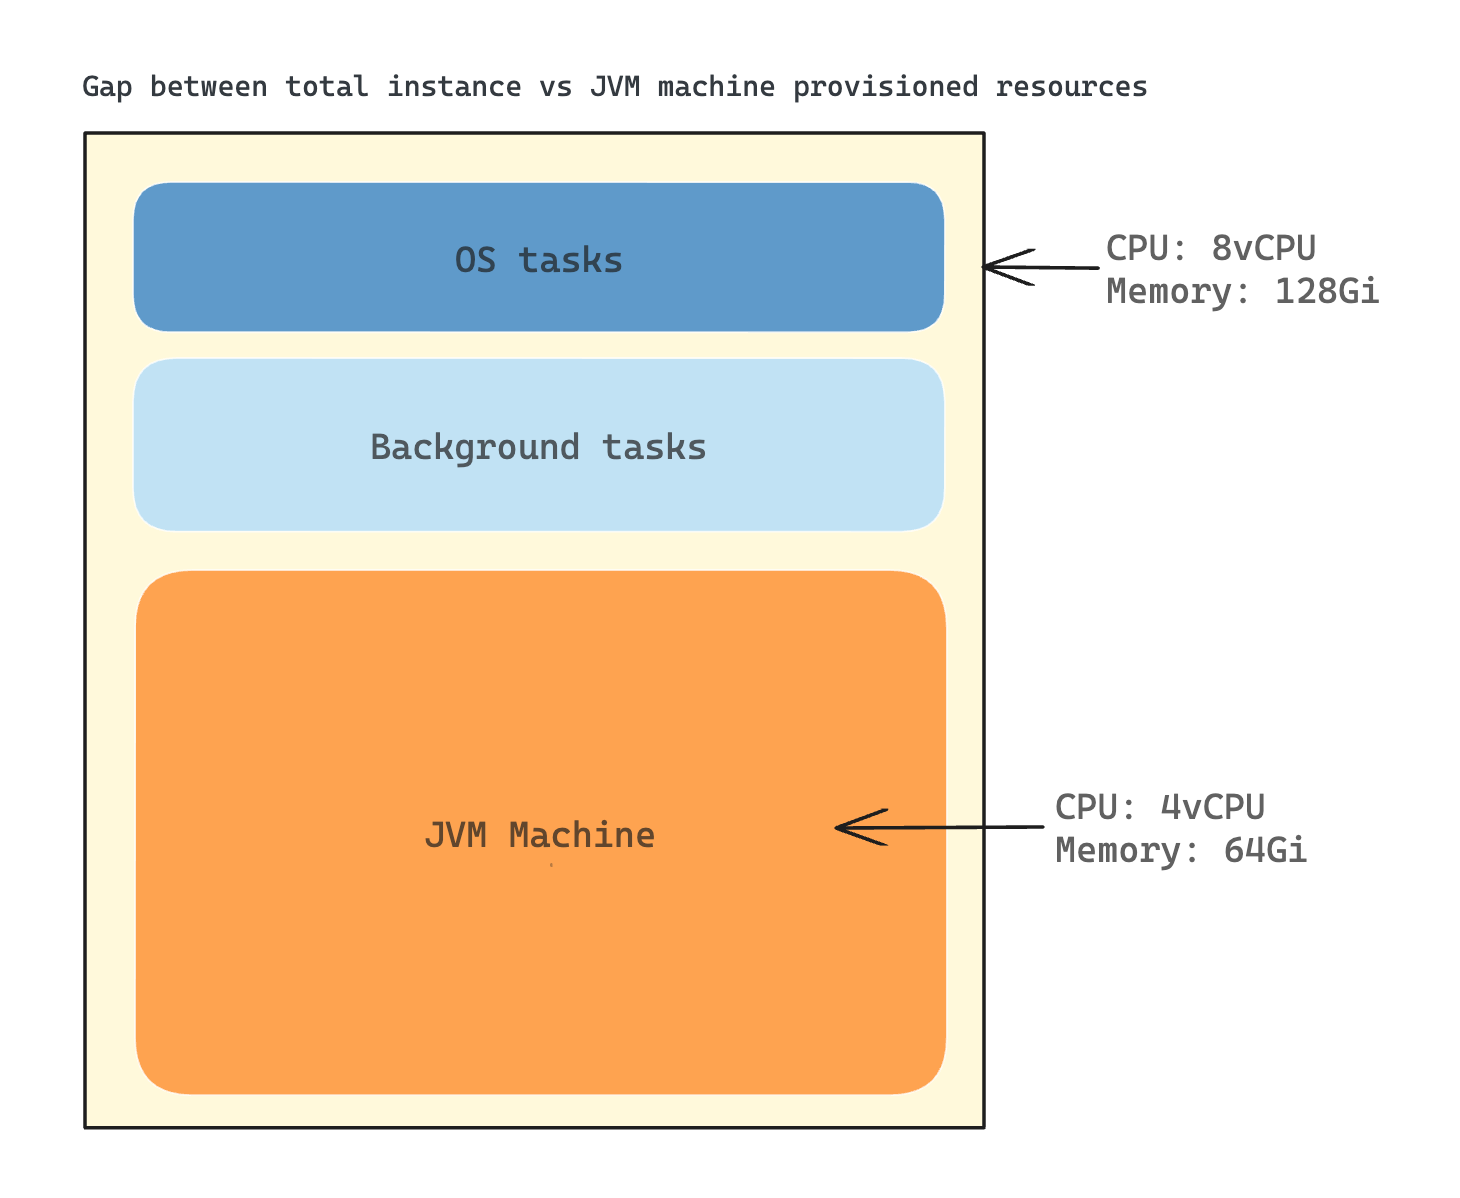
The situation was further complicated when compute instances were shared among various jobs. In such cases, determining the precise resource consumption for a specific job became nearly impossible. This made in-depth analysis and performance optimisation of specific jobs a complex and often ineffective process.
In the initial stages of my career in Spark, I took the reins of handling SEGP ETL jobs deployed in Chimera. Then, Chimera did not possess any tool for observing and understanding SEGP jobs. The lack of an efficient tool for close-to-real-time visualisation of Spark cluster/job metrics, profiling code class/function runtime durations, and investigating deep-level job metrics to assess CPU and memory usage, posed a significant challenge even back then.
In the quest for solutions within Grab, I found no tool that could fulfill all these needs. This prompted me to extend my search beyond the organisation, leading me to discover that Uber had an exceptional tool known as the JVM Profiler. This tool could collect JVM metrics and profile the job. Further research also led me to sparkMeasure, a standalone tool known for its ability to measure Spark metrics on-the-fly without any code changes.
This personal research and journey highlights the importance of a comprehensive, in-depth observability tool - emphasising the need that Iris aims to fulfill in the world of ETL job monitoring. Through this journey, Iris was ideated, named after the Greek deity, encapsulating the mission to bridge the gap between the realm of raw ETL job metrics and the world of actionable insights.
Observability with Iris
Platform architecture
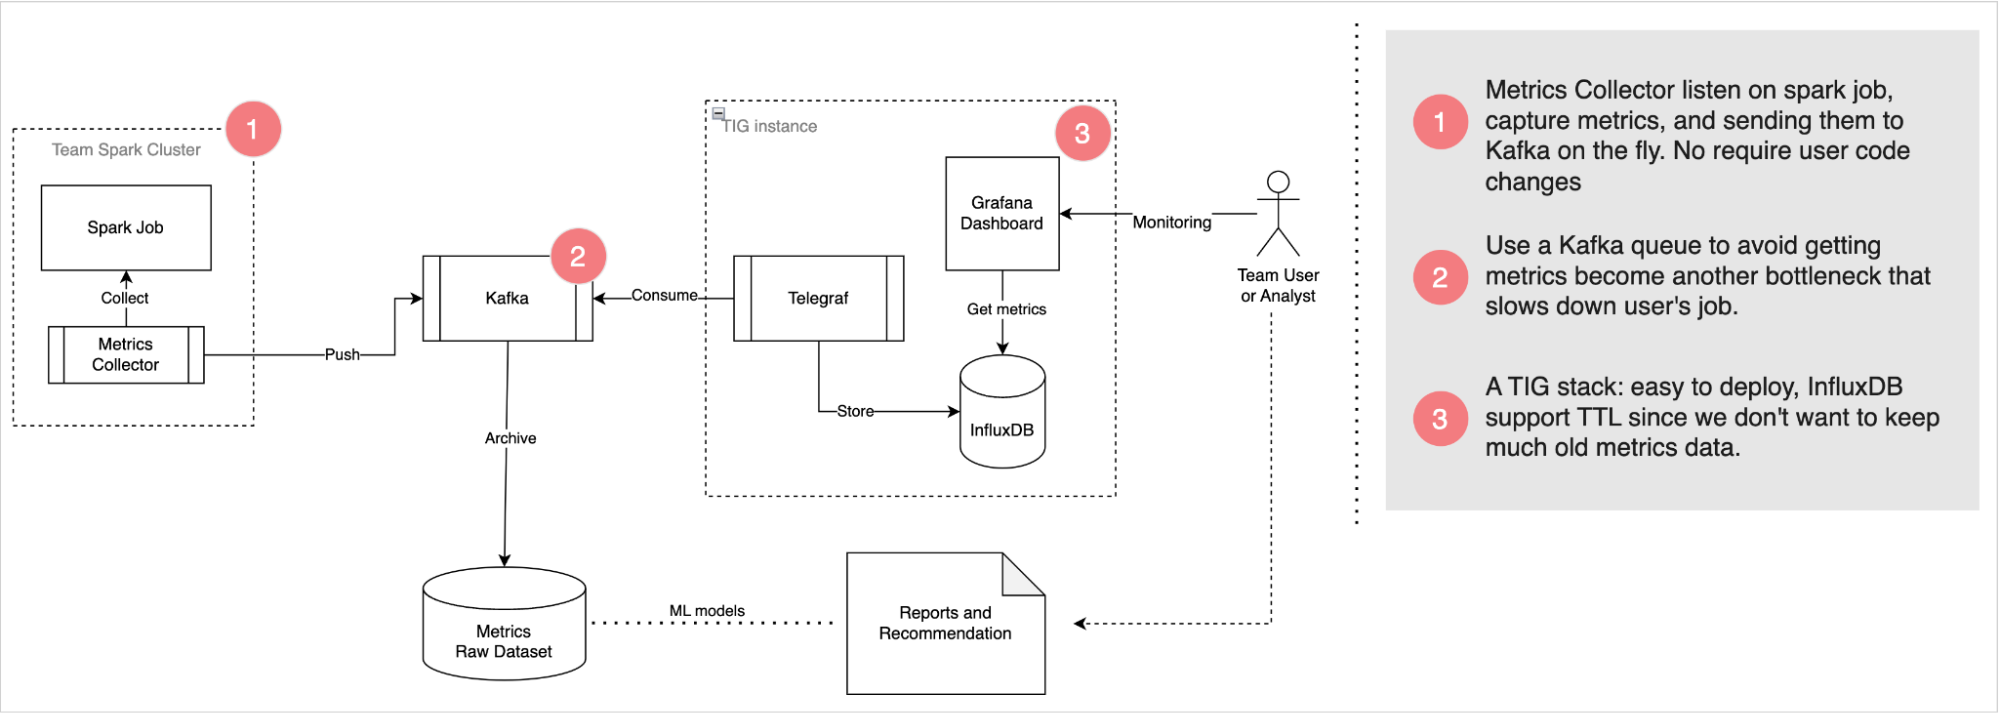
Iris’s robust architecture is designed to smartly deliver observability into Spark jobs with high reliability. It consists of three main modules: Metrics Collector, Kafka Queue, and Telegraf, InfluxDB, and Grafana (TIG) Stack.
Metrics Collector: This module listens to Spark jobs, collects metrics, and funnels them to the Kafka queue. What sets this apart is its unobstructive nature - there is no need for end-users to update their application code or notebook.
Kafka Queue: Serving as an asynchronous deliverer of metrics messages, Kafka is leveraged to prevent Iris from becoming another bottleneck slowing down user jobs. By functioning as a message queue, it enables the efficient processing of metric data.
TIG Stack: This component is utilised for real-time monitoring, making visualising performance metrics a cinch. The TIG stack proves to be an effective solution for real-time data visualisation.
For offline analytics, Iris pushes metrics data from Kafka into our data lake. This creates a wealth of historical data that can be utilised for future research, analysis, and predictions. The strategic combination of real-time monitoring and offline analysis forms the basis of Iris’s ability to provide valuable insights.
Next, we will delve into how Iris collects the metrics.
Data collection
Iris’s metrics is now primarily driven by two tools that operate under the Metrics Collector module: JVM Profiler and sparkMeasure.
JVM Profiler
As mentioned earlier, JVM Profiler is an exceptional tool that helps to collect and profile metrics at JVM level.
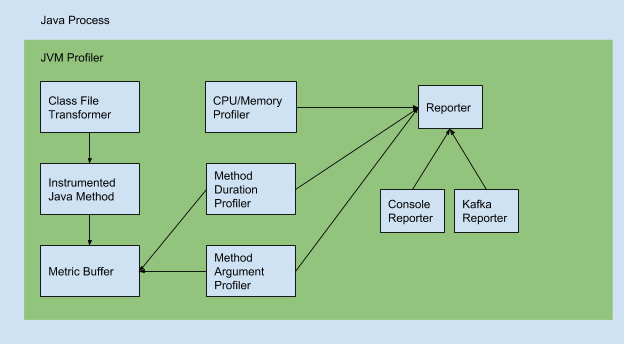
Uber JVM Profiler supports the following features:
- Debug memory usage for all your Spark application executors, including java heap memory, non-heap memory, native memory (VmRSS, VmHWM), memory pool, and buffer pool (directed/mapped buffer).
- Debug CPU usage, garbage collection time for all Spark executors.
- Debug arbitrary Java class methods (how many times they run, how long they take), also called Duration Profiling.
- Debug arbitrary Java class method call and trace its argument value, also known as Argument Profiling.
- Do Stacktrack Profiling and generate flamegraph to visualise CPU time spent for the Spark application.
- Debug I/O metrics (disk read/write bytes for the application, CPU iowait for the machine).
- Debug JVM Thread Metrics like Count of Total Threads, Peak Threads, Live/Active Threads, and newThreads.
Example metrics (Source code)
{
        "nonHeapMemoryTotalUsed": 11890584.0,
        "bufferPools": [
                {
                        "totalCapacity": 0,
                        "name": "direct",
                        "count": 0,
                        "memoryUsed": 0
                },
                {
                        "totalCapacity": 0,
                        "name": "mapped",
                        "count": 0,
                        "memoryUsed": 0
                }
        ],
        "heapMemoryTotalUsed": 24330736.0,
        "epochMillis": 1515627003374,
        "nonHeapMemoryCommitted": 13565952.0,
        "heapMemoryCommitted": 257425408.0,
        "memoryPools": [
                {
                        "peakUsageMax": 251658240,
                        "usageMax": 251658240,
                        "peakUsageUsed": 1194496,
                        "name": "Code Cache",
                        "peakUsageCommitted": 2555904,
                        "usageUsed": 1173504,
                        "type": "Non-heap memory",
                        "usageCommitted": 2555904
                },
                {
                        "peakUsageMax": -1,
                        "usageMax": -1,
                        "peakUsageUsed": 9622920,
                        "name": "Metaspace",
                        "peakUsageCommitted": 9830400,
                        "usageUsed": 9622920,
                        "type": "Non-heap memory",
                        "usageCommitted": 9830400
                },
                {
                        "peakUsageMax": 1073741824,
                        "usageMax": 1073741824,
                        "peakUsageUsed": 1094160,
                        "name": "Compressed Class Space",
                        "peakUsageCommitted": 1179648,
                        "usageUsed": 1094160,
                        "type": "Non-heap memory",
                        "usageCommitted": 1179648
                },
                {
                        "peakUsageMax": 1409286144,
                        "usageMax": 1409286144,
                        "peakUsageUsed": 24330736,
                        "name": "PS Eden Space",
                        "peakUsageCommitted": 67108864,
                        "usageUsed": 24330736,
                        "type": "Heap memory",
                        "usageCommitted": 67108864
                },
                {
                        "peakUsageMax": 11010048,
                        "usageMax": 11010048,
                        "peakUsageUsed": 0,
                        "name": "PS Survivor Space",
                        "peakUsageCommitted": 11010048,
                        "usageUsed": 0,
                        "type": "Heap memory",
                        "usageCommitted": 11010048
                },
                {
                        "peakUsageMax": 2863661056,
                        "usageMax": 2863661056,
                        "peakUsageUsed": 0,
                        "name": "PS Old Gen",
                        "peakUsageCommitted": 179306496,
                        "usageUsed": 0,
                        "type": "Heap memory",
                        "usageCommitted": 179306496
                }
        ],
        "processCpuLoad": 0.0008024004394748531,
        "systemCpuLoad": 0.23138430784607697,
        "processCpuTime": 496918000,
        "appId": null,
        "name": "24103@machine01",
        "host": "machine01",
        "processUuid": "3c2ec835-749d-45ea-a7ec-e4b9fe17c23a",
        "tag": "mytag",
        "gc": [
                {
                        "collectionTime": 0,
                        "name": "PS Scavenge",
                        "collectionCount": 0
                },
                {
                        "collectionTime": 0,
                        "name": "PS MarkSweep",
                        "collectionCount": 0
                }
        ]
}
A list of all metrics and information corresponding to them can be found here.
sparkMeasure
Complementing the JVM Profiler is sparkMeasure, a standalone tool that was built to robustly capture Spark job-specific metrics.
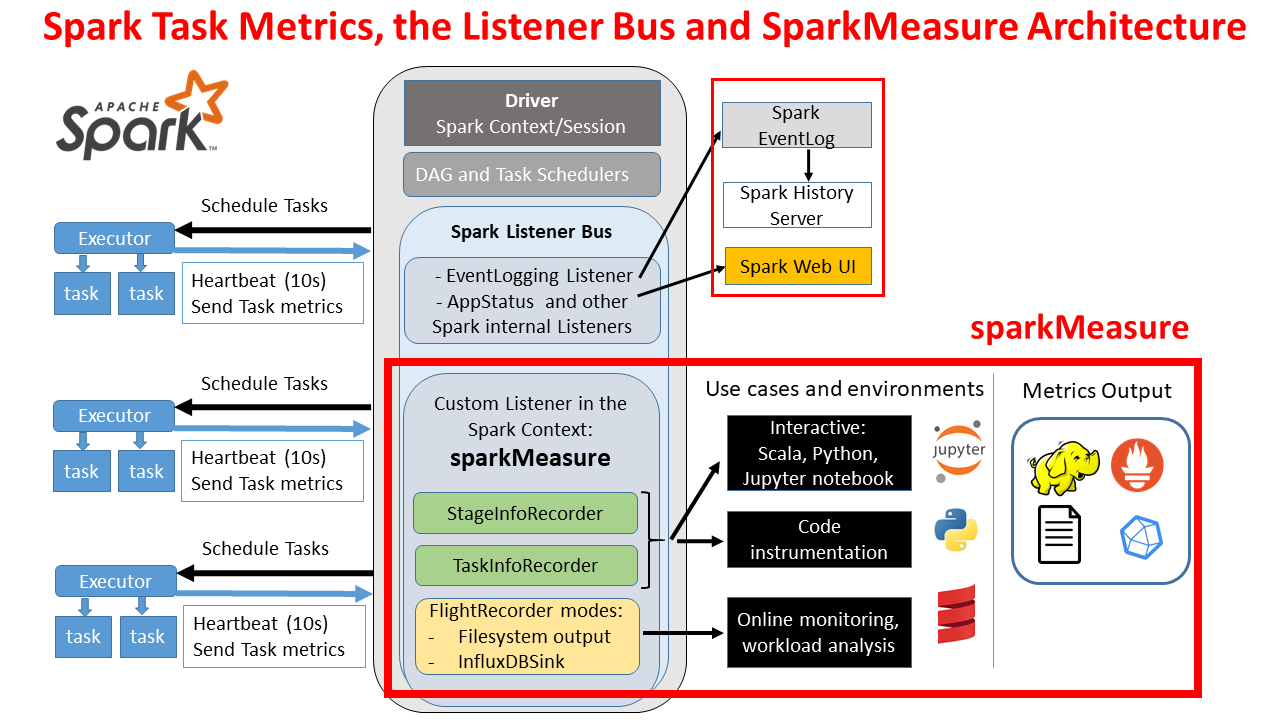
It is registered as a custom listener and operates by collection built-in metrics that Spark exchanges between the driver node and executor nodes. Its standout feature is the ability to collect all metrics supported by Spark, as defined in Spark’s official documentation here.
Example stage metrics collected by sparkMeasure (Source code)
Scheduling mode = FIFO

Spark Context default degree of parallelism = 8

Aggregated Spark stage metrics:

numStages => 3
numTasks => 17
elapsedTime => 1291 (1 s)
stageDuration => 1058 (1 s)
executorRunTime => 2774 (3 s)
executorCpuTime => 2004 (2 s)
executorDeserializeTime => 2868 (3 s)
executorDeserializeCpuTime => 1051 (1 s)
resultSerializationTime => 5 (5 ms)
jvmGCTime => 88 (88 ms)
shuffleFetchWaitTime => 0 (0 ms)
shuffleWriteTime => 16 (16 ms)
resultSize => 16091 (15.0 KB)
diskBytesSpilled => 0 (0 Bytes)
memoryBytesSpilled => 0 (0 Bytes)
peakExecutionMemory => 0
recordsRead => 2000
bytesRead => 0 (0 Bytes)
recordsWritten => 0
bytesWritten => 0 (0 Bytes)
shuffleRecordsRead => 8
shuffleTotalBlocksFetched => 8
shuffleLocalBlocksFetched => 8
shuffleRemoteBlocksFetched => 0
shuffleTotalBytesRead => 472 (472 Bytes)
shuffleLocalBytesRead => 472 (472 Bytes)
shuffleRemoteBytesRead => 0 (0 Bytes)
shuffleRemoteBytesReadToDisk => 0 (0 Bytes)
shuffleBytesWritten => 472 (472 Bytes)
shuffleRecordsWritten => 8

Stages and their duration:
Stage 0 duration => 593 (0.6 s)
Stage 1 duration => 416 (0.4 s)
Stage 3 duration => 49 (49 ms)
Data organisation
The architecture of Iris is designed to efficiently route metrics to two key destinations:
- Real-time datasets: InfluxDB
- Offline datasets: GrabTech Datalake in AWS
Real-time dataset
Freshness/latency: 5 to 10 seconds
All metrics flowing in through Kafka topics are instantly wired into InfluxDB. A crucial part of this process is accomplished by Telegraf, a plugin-driven server agent used for collecting and sending metrics. Acting as a Kafka consumer, Telegraf listens to each Kafka topic according to its corresponding metrics profiling. It parses the incoming JSON messages and extracts crucial data points (such as role, hostname, jobname, etc.). Once the data is processed, Telegraf writes it into the InfluxDB.
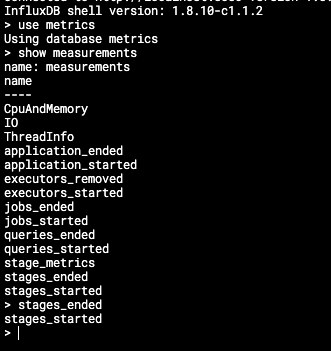
InfluxDB organises the stored data in what we call ‘measurements’, which could analogously be considered as tables in traditional relational databases.
In Iris’s context, we have structured our real-time data into the following crucial measurements:
|
|
jobs_startedandjobs_ended: These provide vital data points relating to the lifecycle of individual Spark jobs within applications.queries_startedandqueries_ended: These measurements are designed to track the lifecycle of individual Spark SQL queries.stage_metrics,stages_started, andstages_ended: These measurements help monitor individual stages within Spark jobs, a valuable resource for tracking the job progress and identifying potential bottlenecks.
The real-time data collected in these measurements form the backbone of the monitoring capabilities of Iris, providing an accurate and current picture of Spark job performances.
Offline dataset
Freshness/latency: 1 hour
|
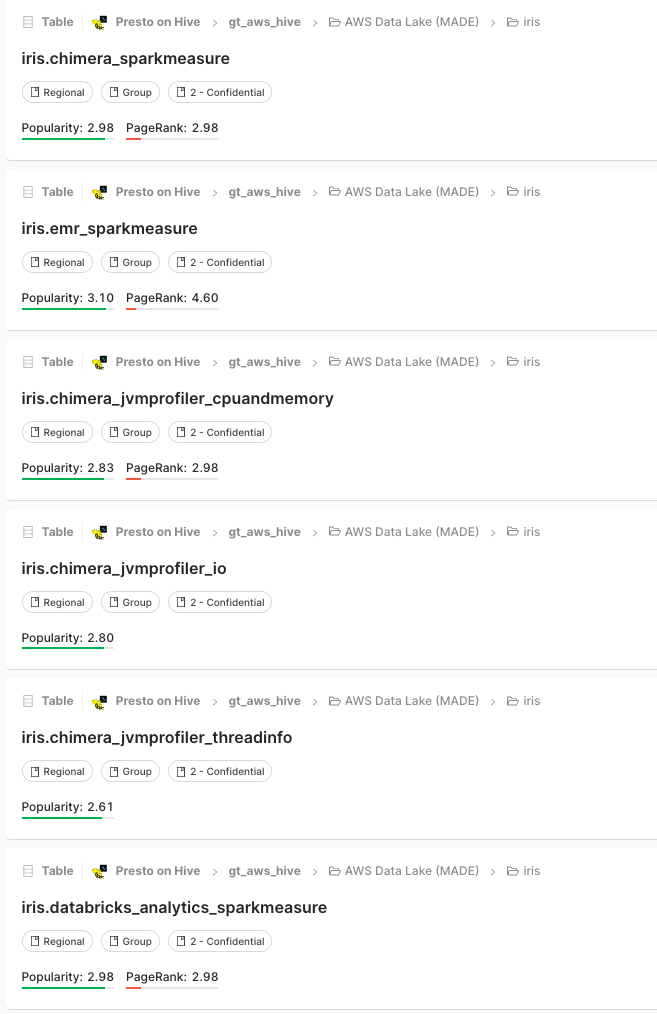
In addition to real-time data management with InfluxDB, Iris is also responsible for routing metrics to our offline data storage in the Grab Tech Datalake for long-term trend studies, pattern analysis, and anomaly detection. The metrics from Kafka are periodically synchronised to the Amazon S3 tables under the iris schema in the Grab Tech AWS catalogue. This valuable historical data from Kafka is meticulously organised with a one-to-one mapping between the platform or Kafka topic to the table in the iris schema. For example: iris.chimera_jvmprofiler_cpuandmemory map with prd-iris-chimera-jvmprofiler-cpuandmemory Kafka topic.
|
|
This streamlined organisation means you can write queries to retrieve information from the AWS dataset very similarly to how you would do it from InfluxDB. Whether it’s CPU and memory usage, I/O, thread info, or spark metrics, you can conveniently fetch historical data for your analysis.
Data visualisation
A well-designed visual representation makes it easier to see patterns, trends, and outliers in groups of data. Iris employs different visualisation tools based on whether the data is real-time or historical.
Real-Time data visualisation - Grafana
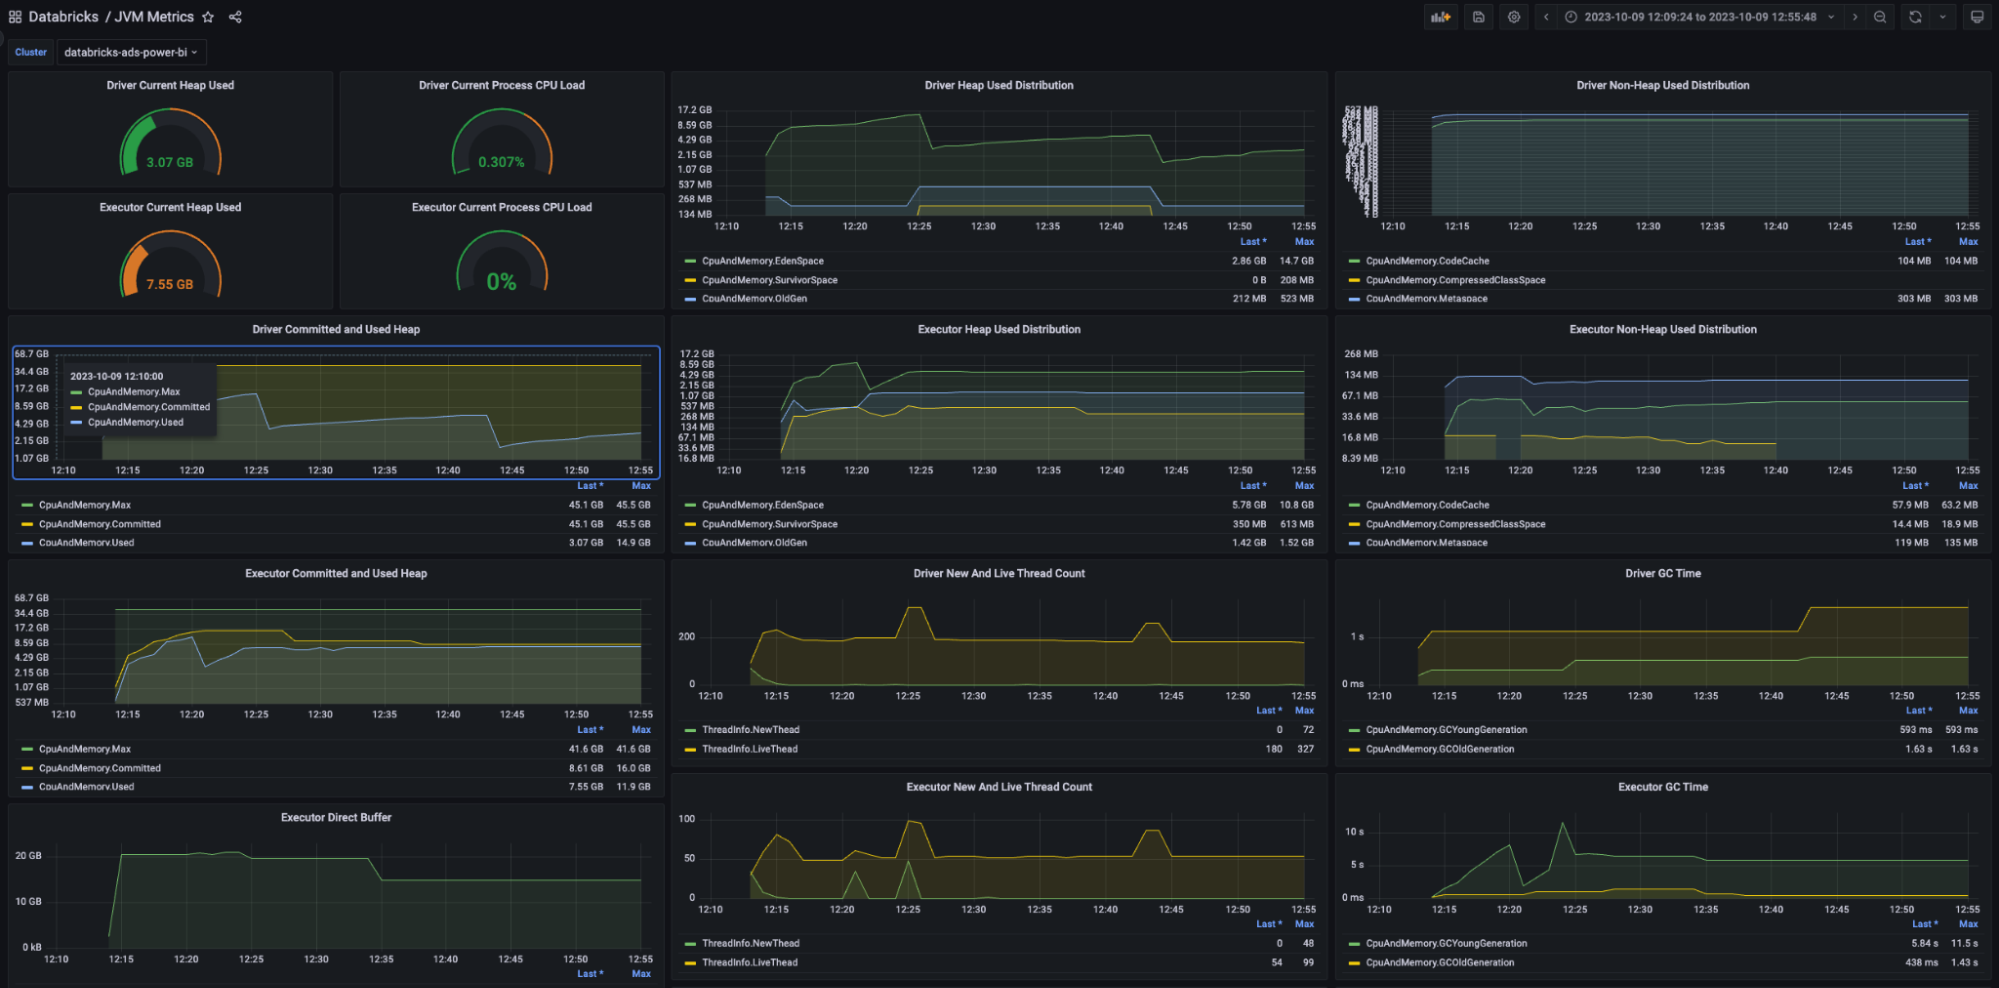
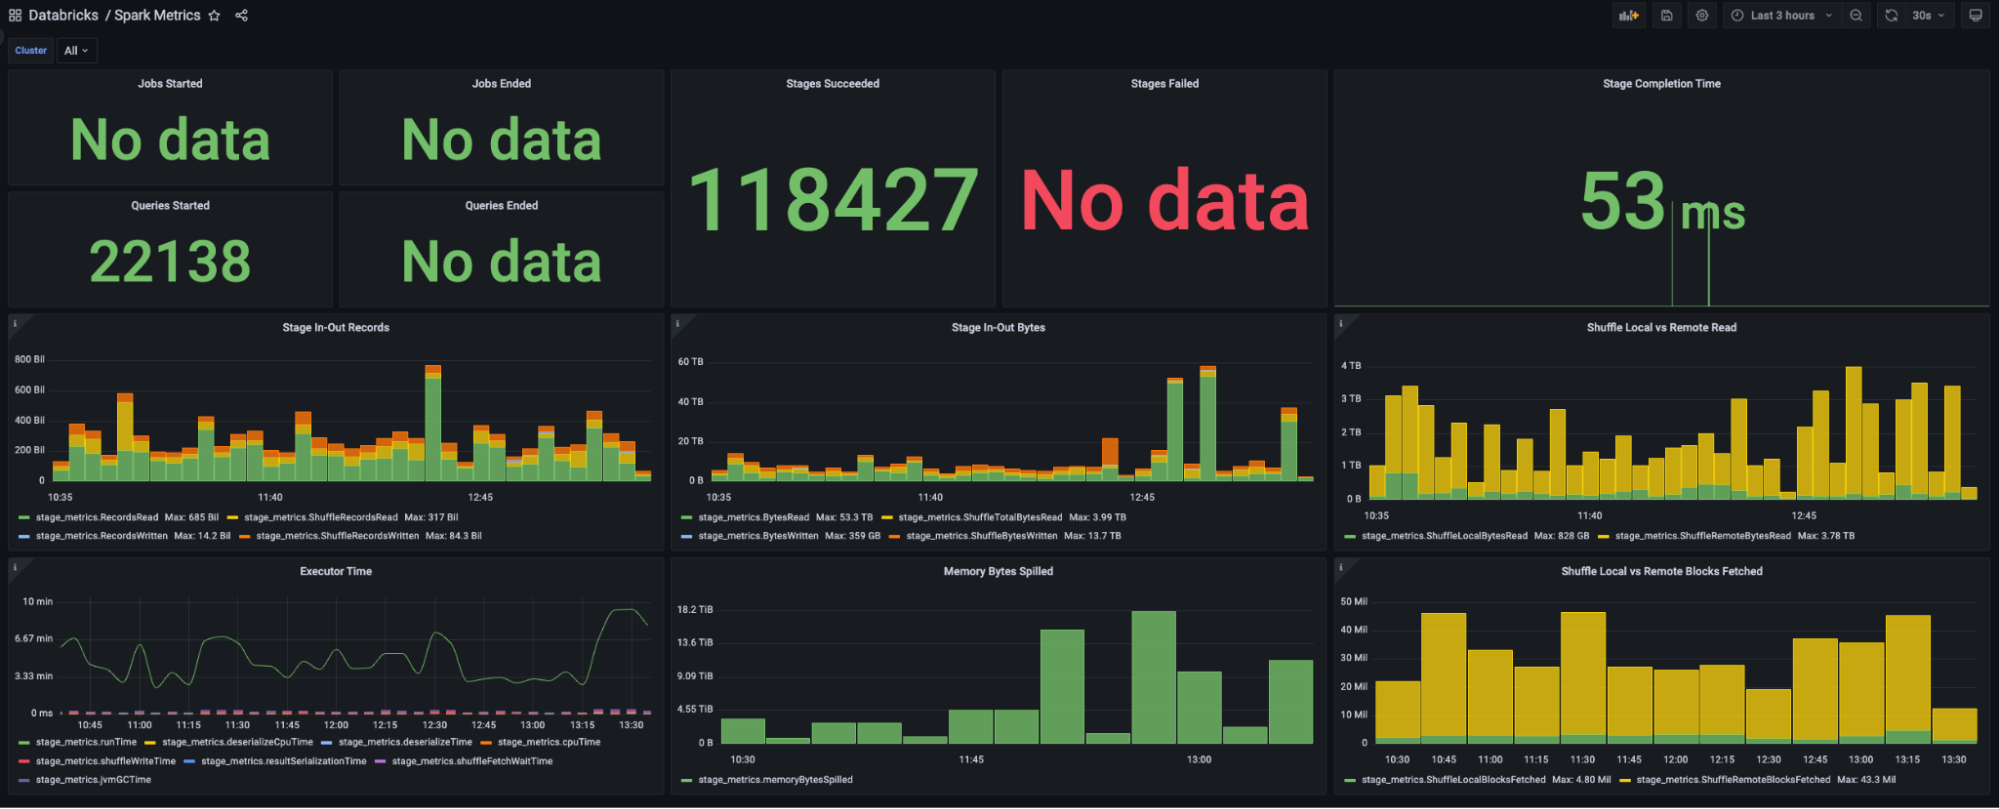
Iris uses Grafana for showcasing real-time data. For each platform, two primary dashboards have been set up: JVM metrics and Spark metrics.
Offline data visualisation
While real-time visualisation is crucial for immediate awareness and decision-making, visualising historical data provides invaluable insights about long-term trends, patterns, and anomalies. Developers can query the raw or aggregated data from the Iris tables for their specific analyses.
Moreover, to assist platform owners and end-users in obtaining a quick summary of their job data, we provide built-in dashboards with pre-aggregated visuals. These dashboards contain a wealth of information expressed in an easy-to-understand format. Key metrics include:
|
|
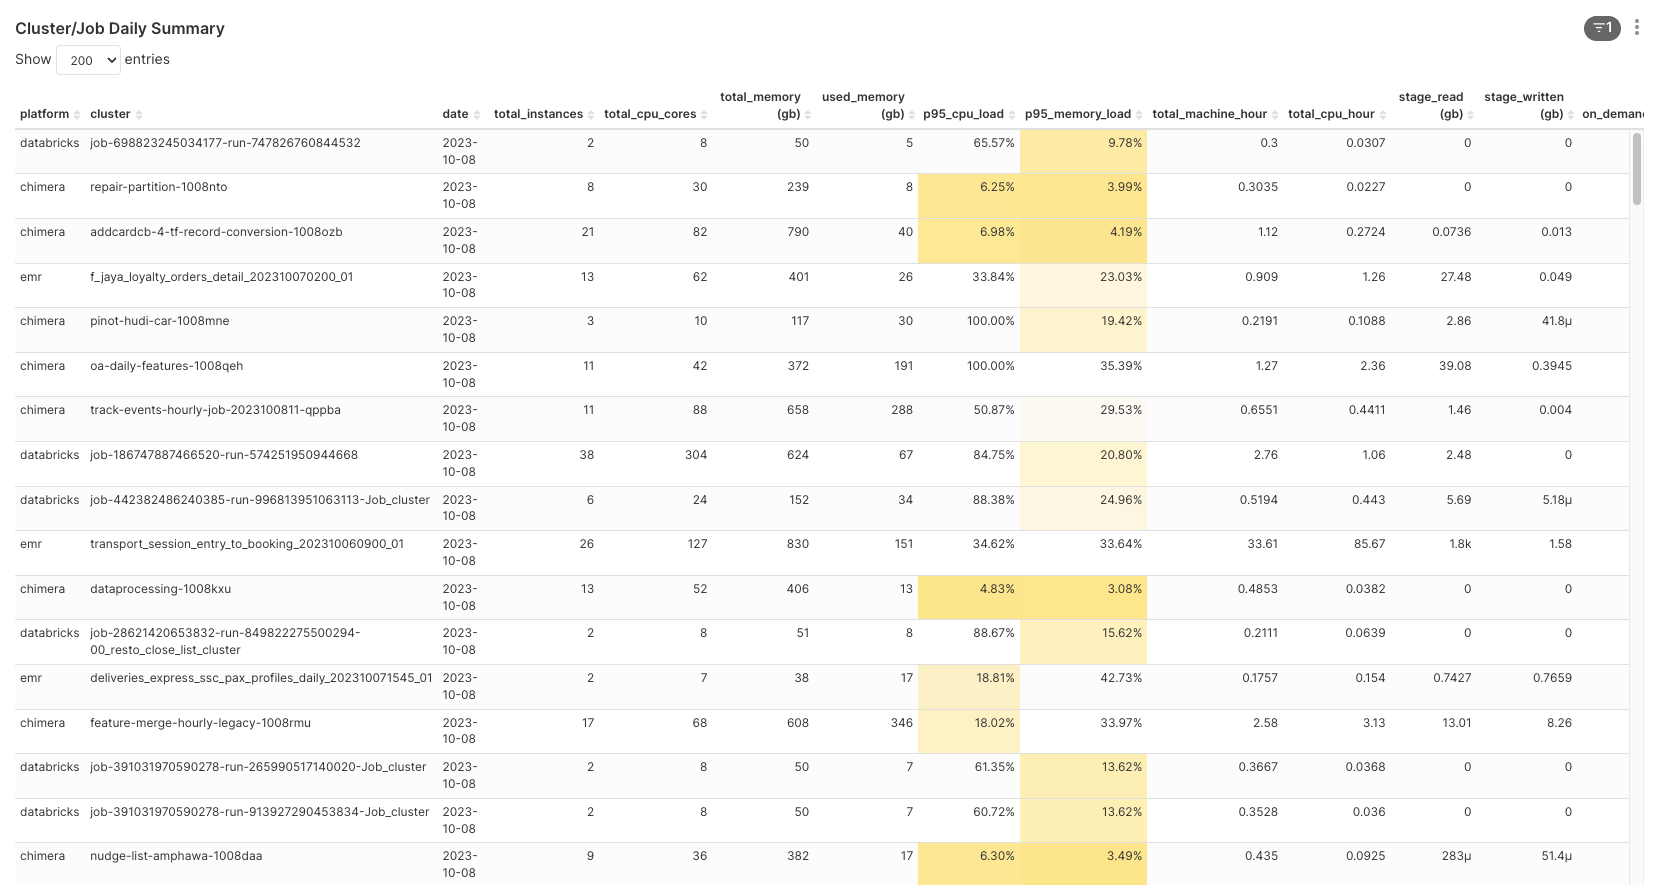
|
Besides visualisations for individual jobs, we have designed an overview dashboard providing a comprehensive summary of all resources consumed by all ETL jobs. This is particularly useful for platform owners and tech leads, allowing them to have an all-encompassing visibility of the performance and resource usage across the ETL jobs.
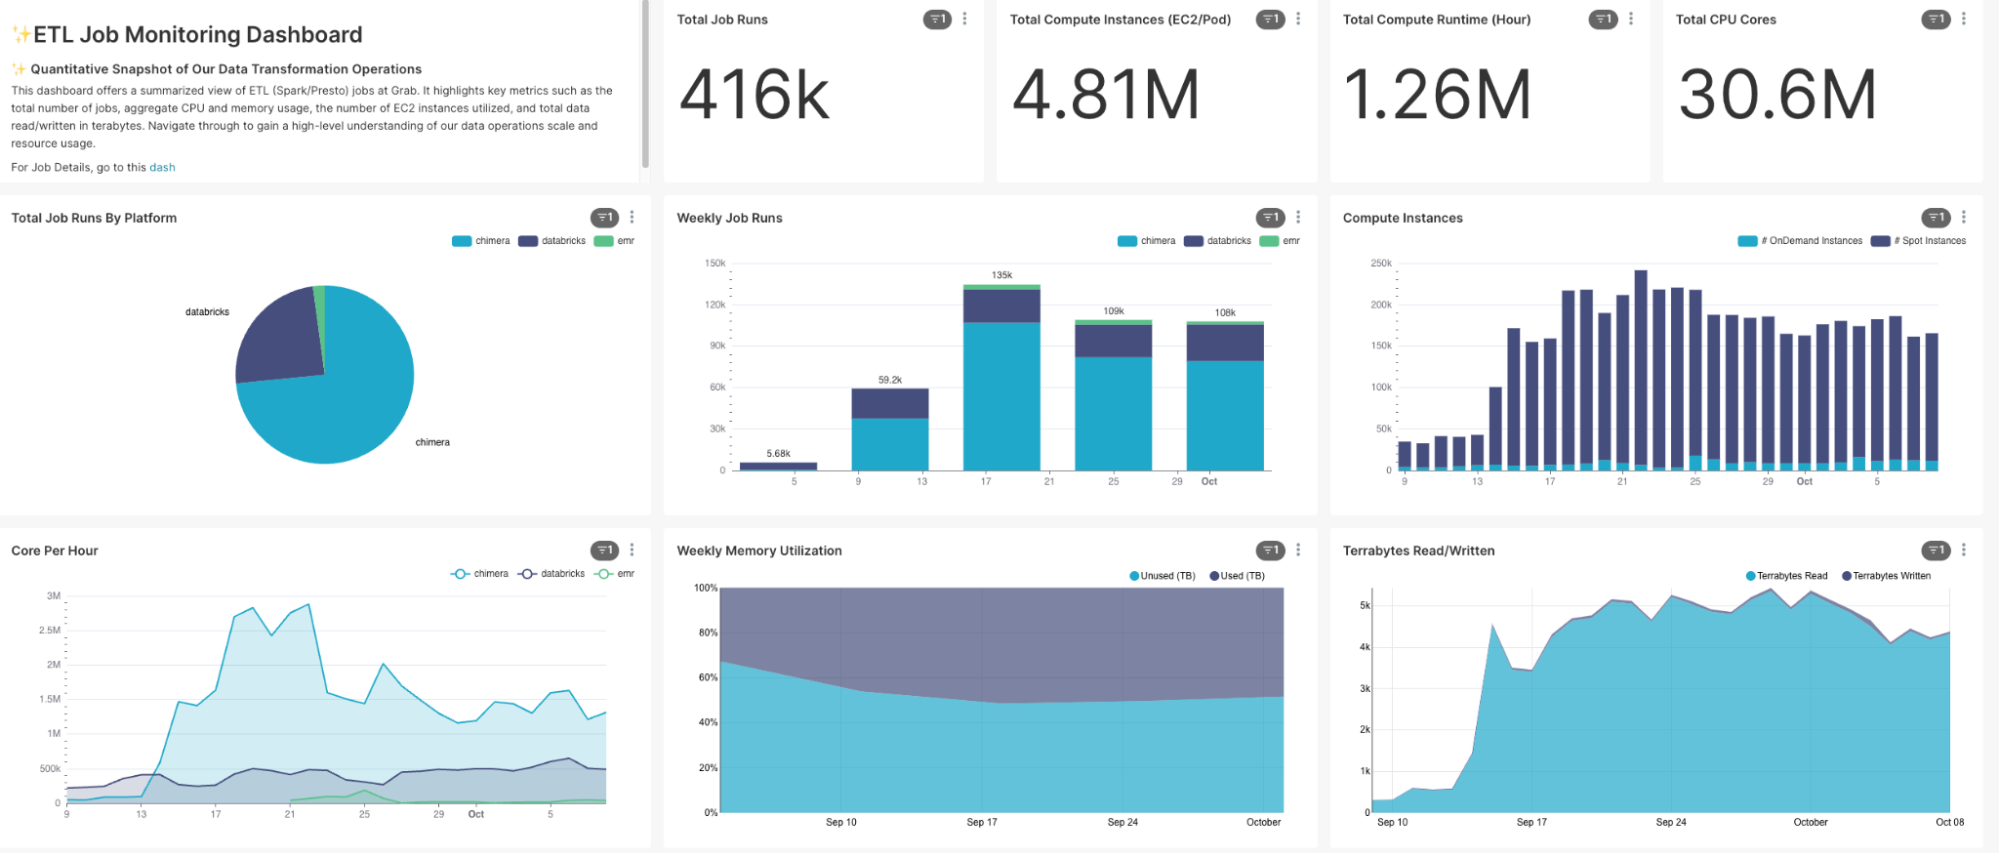
These dashboards’ visuals effectively turn the historical metrics data into clear, comprehensible, and insightful information, guiding users towards objective-driven decision-making.
Transforming observations into insights
While our journey with Iris is just in the early stages, we’ve already begun harnessing its ability to transform raw data into concrete insights. The strength of Iris lies not just in its data collection capabilities but also in its potential to analyse and infer patterns from the collated data.
Currently, we’re experimenting with a job classification model that aims to predict resource allocation efficiency (i.e. identifying jobs as over or under-provisioned). This information, once accurately predicted, can help optimise the usage of resources by fine-tuning the provisions for each job. While this model is still in its early stages of testing and lacks sufficient validation data, it exemplifies the direction we’re heading - integrating advanced analytics with operational observability.
As we continue to refine Iris and develop more models, our aim is to empower users with deep insights into their Spark applications. These insights can potentially identify bottlenecks, optimise resource allocation and ultimately, enhance overall performance. In the long run, we see Iris evolving from being a data collection tool to a platform that can provide actionable recommendations and enable data-driven decision-making.
Job classification feature set
At the core of our job classification model, there are two carefully selected metrics:
-
CPU cores per hour: This represents the number of tasks a job can handle concurrently in a given hour. A higher number would mean more tasks being processed simultaneously.
-
Total Terabytes of data input per core: This considers only the input from the underlying HDFS/S3 input, excluding shuffle data. It represents the volume of data one CPU core needs to process. A larger input would mean more CPUs are required to complete the job in a reasonable timeframe.

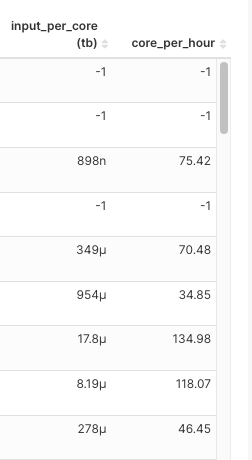
The choice of these two metrics for building feature sets is based on a nuanced understanding of Spark job dynamics:
|
|
|
As for CPU and memory utilisation, while it could offer useful insights, we’ve found it may not always contribute to predicting if a job is over or under-provisioned because utilisation can vary run-to-run. Thus, to keep our feature set robust and consistent, we primarily focus on CPU cores per hour and total terabytes of input data.
With these metrics as our foundation, we are developing models that can classify jobs into over-provisioned or under-provisioned, helping us optimise resource allocation and improve job performance in the long run.
As always, treat any information related to our job classification feature set and the insights derived from it with utmost care for data confidentiality and integrity.
We’d like to reiterate that these models are still in the early stages of testing and we are constantly working to enhance their predictive accuracy. The true value of this model will be unlocked as it is refined and as we gather more validation data.
Model training and optimisation
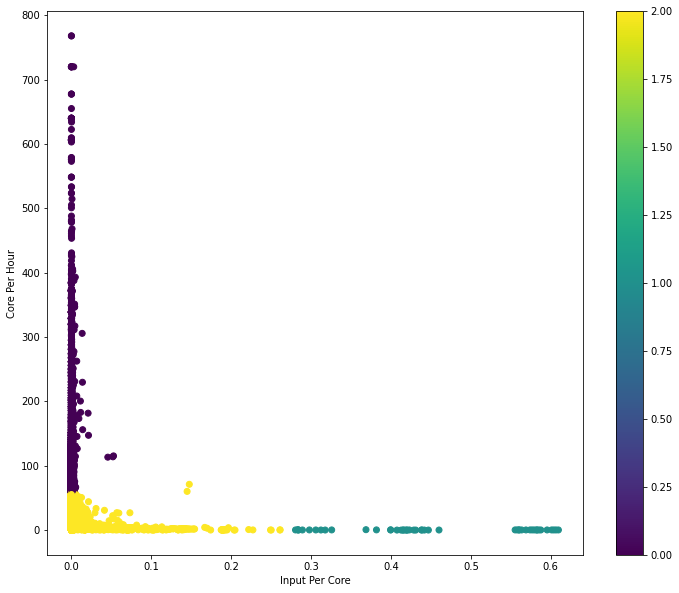
Choosing the right model is crucial for deriving meaningful insights from datasets. We decided to start with a simple, yet powerful algorithm - K-means clustering, for job classification. K-means is a type of unsupervised machine learning algorithm used to classify items into groups (or clusters) based on their features.
Here is our process:
- Model exploration: We began by exploring the K-means algorithm using a small dataset for validation.
- Platform-specific cluster numbers: To account for the uniqueness of every platform, we ran a Score Test (an evaluation method to determine the optimal number of clusters) for each platform. The derived optimal number of clusters is then used in the monthly job for that respective platform’s data.
- Set up a scheduled job: After ensuring the code was functioning correctly, we set up a job to run the model on a monthly schedule. Monthly re-training was chosen to encapsulate possible changes in the data patterns over time.
- Model saving and utilisation: The trained model is saved to our S3 bucket and used to classify jobs as over-provisioned or under-provisioned based on the daily job runs.
This iterative learning approach, through which our model learns from an ever-increasing pool of historical data, helps maintain its relevance and improve its accuracy over time.
|
Here is an example output from Databricks train run: |
|
Keep in mind that classification insights provided by our K-means model are still in the experimental stage. As we continue to refine the approach, the reliability of these insights is expected to grow, providing increasingly valuable direction for resource allocation optimisation.
Seeing Iris in action
This section provides practical examples and real-case scenarios that demonstrate Iris’s capacity for delivering insights from ETL job observations.
Case study 1: Spark benchmarking
From August to September 2023, we carried out a Spark benchmarking exercise to measure and compare the cost and performance of Grab’s Spark platforms: Open Source Spark on Kubernetes (Chimera), Databricks and AWS EMR. Since each platform has its own way to measure a job’s performance and cost, Iris was used to collect the necessary Spark metrics in order to calculate the cost for each job. Furthermore, many other metrics were collected by Iris in order to compare the platforms’ performances like CPU and memory utilisation, runtime, etc.
Case study 2: Improving Databricks Infra Cost Unit (DBIU) Accuracy with Iris
Being able to accurately calculate and fairly distribute Databricks infrastructure costs has always been a challenge, primarily due to difficulties in distinguishing between on-demand and Spot instance usage. This was further complicated by two conditions:
- Fallback to on-demand instances: Databricks has a feature that automatically falls back to on-demand instances when Spot instances are not readily available. While beneficial for job execution, this feature has traditionally made it difficult to accurately track per-job Spot vs. on-demand usage.
- User configurable hybrid policy: Users can specify a mix of on-demand and Spot instances for their jobs. This flexible, hybrid approach often results in complex, non-uniform usage patterns, further complicating cost categorisation.
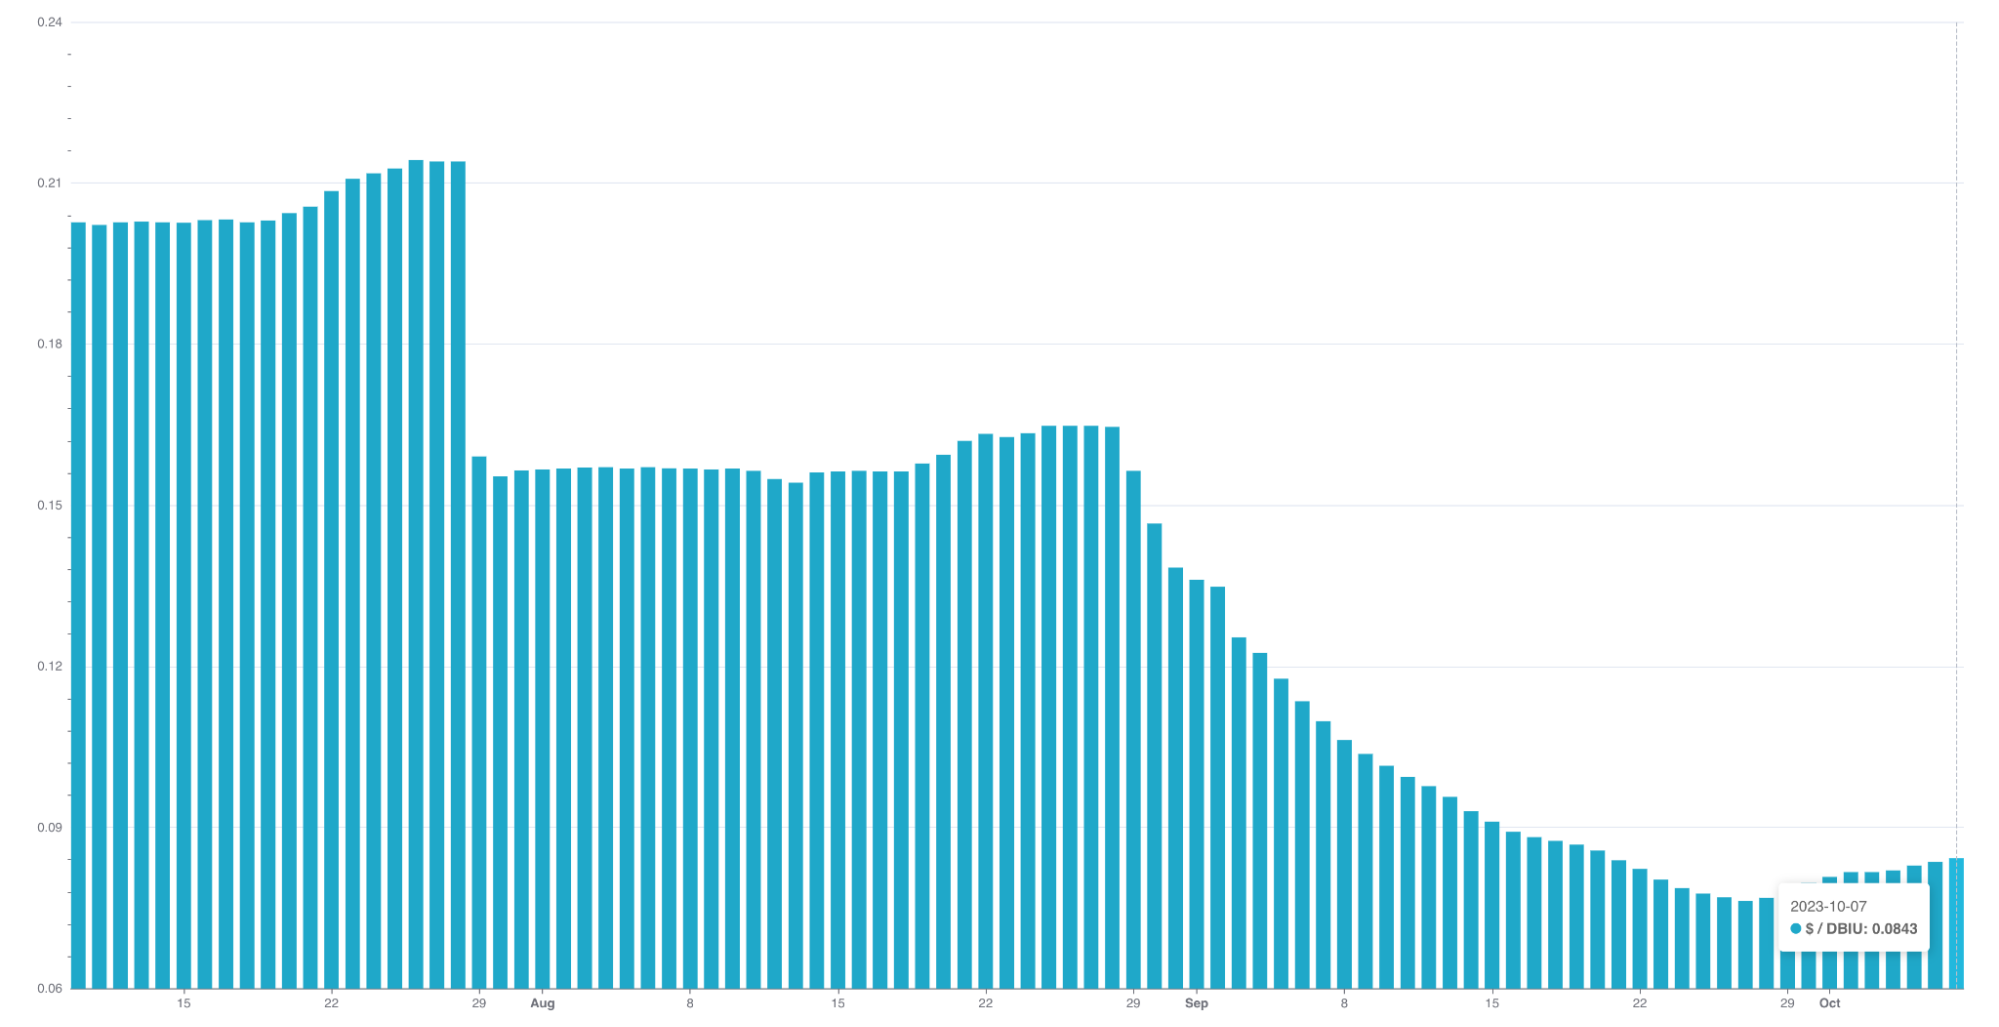
Iris has made a key difference in resolving these dilemmas. By providing granular, instance-level metrics including whether each instance is on-demand or Spot, Iris has greatly improved our visibility into per-job instance usage.
| This precise data enables us to isolate the on-demand instance usage, which was previously bundled in the total cost calculation. Similarly, it allows us to accurately gauge and consider the usage ratio of on-demand instances in hybrid policy scenarios. |
|
The enhanced transparency provided by Iris metrics allows us to standardise DBIU cost calculations, making them fairer for users who majorly or only use Spot instances. In other words, users need to pay more if they intentionally choose or fall back to on-demand instances for their jobs.
The practical application of Iris in enhancing DBIU accuracy illustrates its potential in driving data-informed decisions and fostering fairness in resource usage and cost distribution.
Case study 3: Optimising job configuration for better performance and cost efficiency
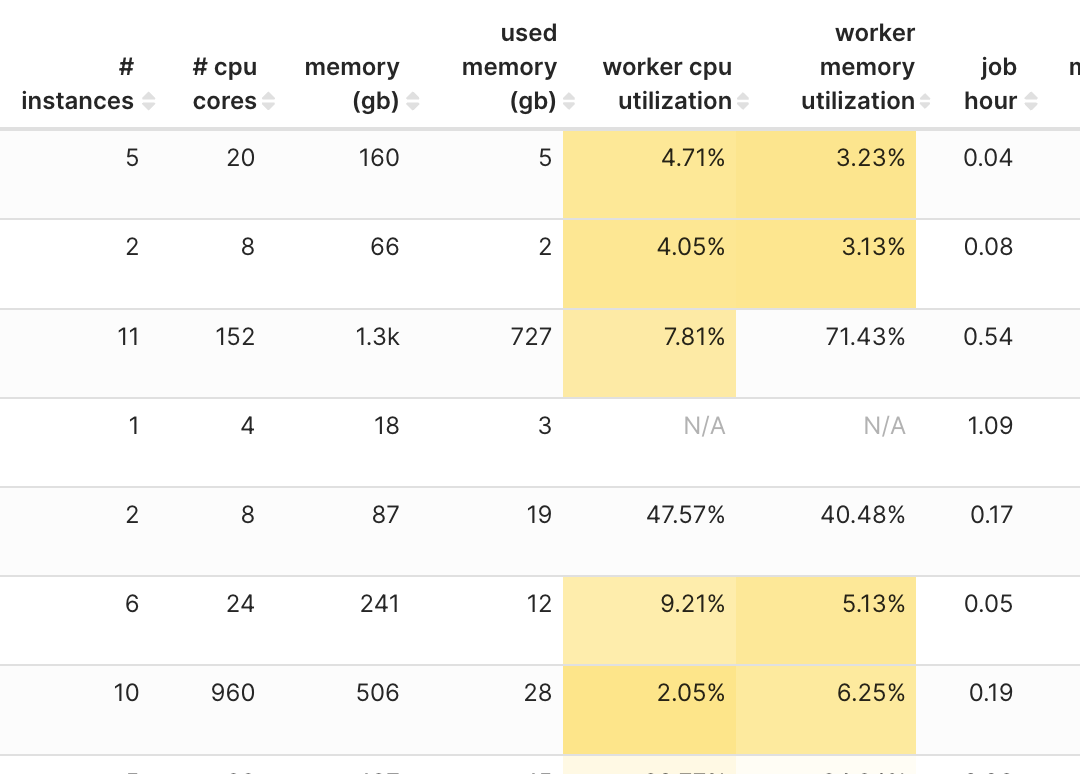
One of the key utilities of iris is its potential to assist with job optimisation. For instance, we have been able to pinpoint jobs that were consistently over-provisioned and work with end-users to tune their job configurations.
Through this exercise and continuous monitoring, we’ve seen substantial results from the job optimisations:
|
|
|
By the way, interestingly, our analysis led us to identify certain the following patterns. These patterns could be leveraged to widen the impact of our optimisation efforts across multiple use-cases in our platforms:
| Pattern | Recommendation |
|---|---|
|
|
|
|
|
|
However, we acknowledge that these findings may not apply uniformly to every instance. The optimisation recommendations derived from these patterns might not yield the desired outcomes in all cases.
The future of Iris
Building upon its firm foundation as a robust Spark observability tool, we envision a future for Iris wherein it not only monitors metrics but provides actionable insights, discerns usage patterns, and drives predictions.
Our plans to make Iris more accessible include developing APIs endpoint for platform teams to query performance by job names. Another addition we’re aiming for is the ability for Iris to provide resource tuning recommendations. By making platform-specific and job-specific recommendations easily accessible, we hope to assist platform teams in making informed, data-driven decisions on resource allocation and cost efficiency.
We’re also looking to expand Iris’s capabilities with the development of a listener for Presto jobs, similar to the sparkMeasure tool currently used for Spark jobs. The listener would provide valuable metrics and insights into the performance of Presto jobs, opening up new avenues for optimisation and cost management.
Another major focus will be building a feedback loop for Iris to further enhance accuracy, continually refine its models, and improve insights provided. This effort would greatly benefit from the close collaboration and inputs from platform teams and other tech leads, as their expertise aids in interpreting Iris’s metrics and predictions and validating its meaningfulness.
In conclusion, as Iris continues to develop and mature, we foresee it evolving into a crucial tool for data-driven decision-making and proactive management of Spark applications, playing a significant role in the efficient usage of cloud computing resources.
Conclusion
The role of Iris as an observability tool for Spark jobs in the world of Big Data is rapidly evolving. Iris has proven to be more than a simple data collection tool; it is a platform that integrates advanced analytics with operational observability.
Even though Iris is in its early stages, it’s already been instrumental in creating detailed visualisations of both real-time and historical data from varied platforms. Besides that, Iris has started making strides in its journey towards using machine learning models like K-means clustering to classify jobs, demonstrating its potential in helping operators fine-tune resource allocation.
Using instance-level metrics, Iris is helping improve cost distribution fairness and accuracy, making it a potent tool for resource optimisation. Furthermore, the successful case study of reducing job costs and enhancing performance through resource reallocation provides a promising outlook into Iris’s future applicability.
With ongoing development plans, such as the Presto listener and the creation of endpoints for broader accessibility, Iris is poised to become an integral tool for data-informed decision-making. As we strive to enhance Iris, we will continue to collaborate with platform teams and tech leads whose feedback is invaluable in fulfilling Iris’s potential.
Our journey with Iris is a testament to Grab’s commitment to creating a data-informed and efficient cloud computing environment. Iris, with its observed and planned capabilities, is on its way to revolutionising the way resource allocation is managed and optimised.
Join us
Grab is the leading superapp platform in Southeast Asia, providing everyday services that matter to consumers. More than just a ride-hailing and food delivery app, Grab offers a wide range of on-demand services in the region, including mobility, food, package and grocery delivery services, mobile payments, and financial services across 428 cities in eight countries.
Powered by technology and driven by heart, our mission is to drive Southeast Asia forward by creating economic empowerment for everyone. If this mission speaks to you, join our team today!

