 Engineering
Journey to a Faster Everyday Superapp Where Every Millisecond Counts

Introduction
At Grab, we are moving faster than ever. In 2019 alone, we released dozens of new features in the Grab passenger app. With our goal to delight users in Southeast Asia with a powerful everyday superapp, the app’s performance became one of the most critical components in delivering that experience to our users.
This post narrates the journey of our performance improvement efforts on the Grab passenger app. It highlights how we were able to reduce the time spent starting the app by more than 60%, while preventing regressions introduced by new features. We use the p95 scale when referring to these improvements.
Here’s a quick look at the improvements and timeline:
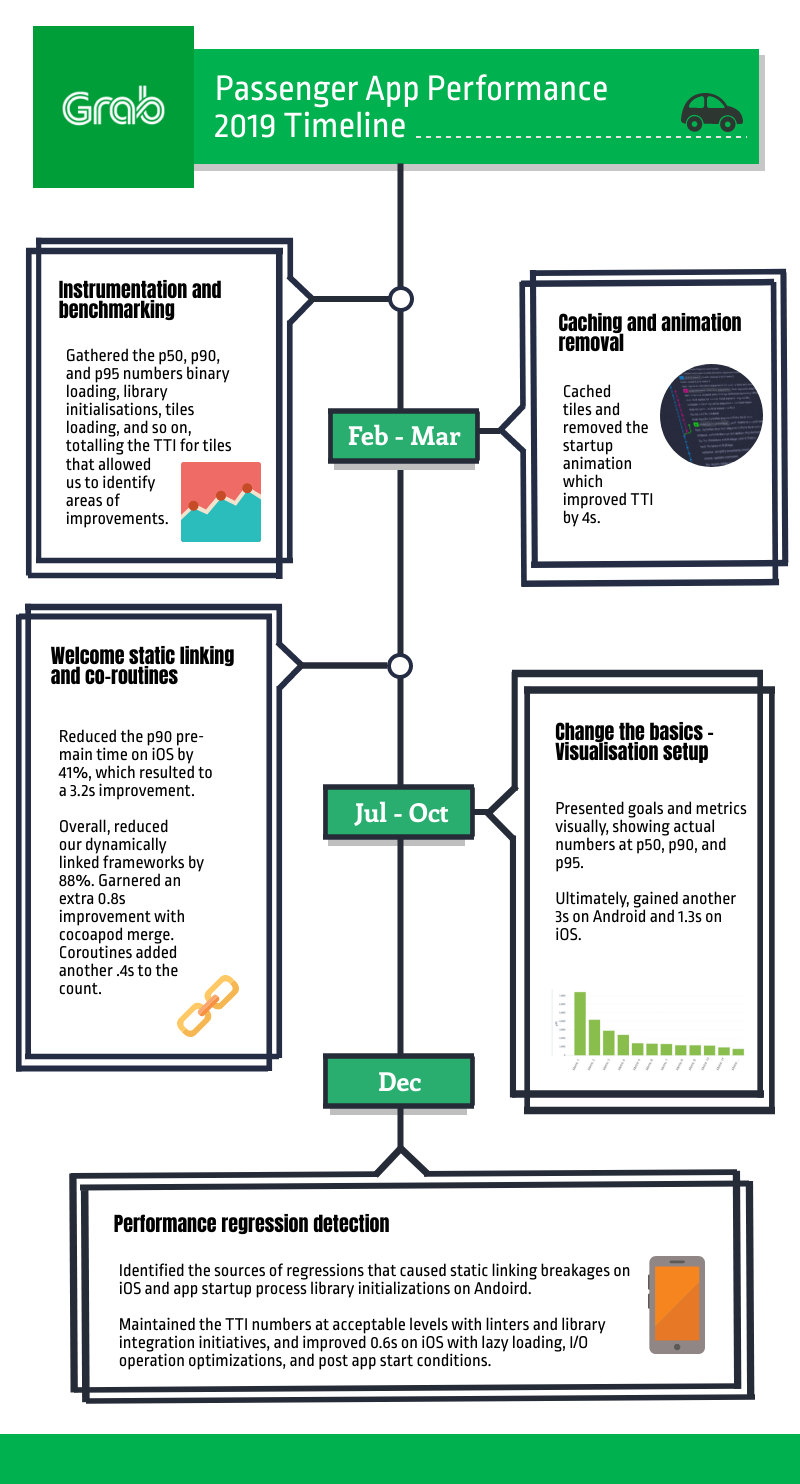
Improving App Performance
While app performance consists of different aspects - such as battery consumption rate, network performance, app responsiveness, etc. - the first thing users notice is the time it takes for an app to start. Apps that take too long to load frustrate users, leading to bad reviews and uninstalls.
We focused our efforts on the app’s time to interactive(TTI), which consists of two main operations:
- Starting the app
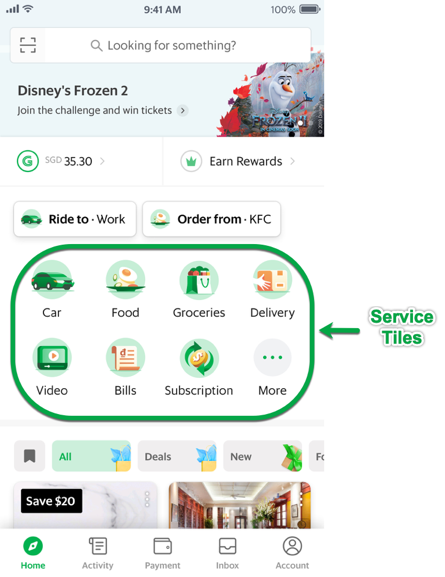
- Displaying interactive service tiles (these are the icons for the services offered on the app such as Transport, Food, Delivery, and so on)
There are many other operations that occur in the background, which we won’t cover in this article.
We prioritised on optimising the app’s ability to load the service tiles (highlighted in the image below) and render them as interactive upon startup (cold start). This allowed users to use the app as soon as they launch it.
Instrumentation and Benchmarking
Before we could start improving the app’s performance, we needed to know where we stood and set measurable goals.
We couldn’t get a baseline from local performance testing as it did not simulate the real environment condition, where network variability and device performance are contributing factors. Thus, we needed to use real production data to get an accurate reflection of our current performance at a scale. In production, we measured the performance of ~8-9 millions users per day - a small subset of our overall active user base.
As a start, we measured the different components contributing to TTI, such as binary loading, library initialisations, and tiles loading. For example, if we had to measure the time taken by function A, this is how it looked like in the code:
functionA (){
// start the timer
....
....
...
//Stop the timer, calculate the time difference and send it as an analytic event
}
With all the numbers from the contributing components, we took the sum to calculate the full TTI (as shown in the following image).
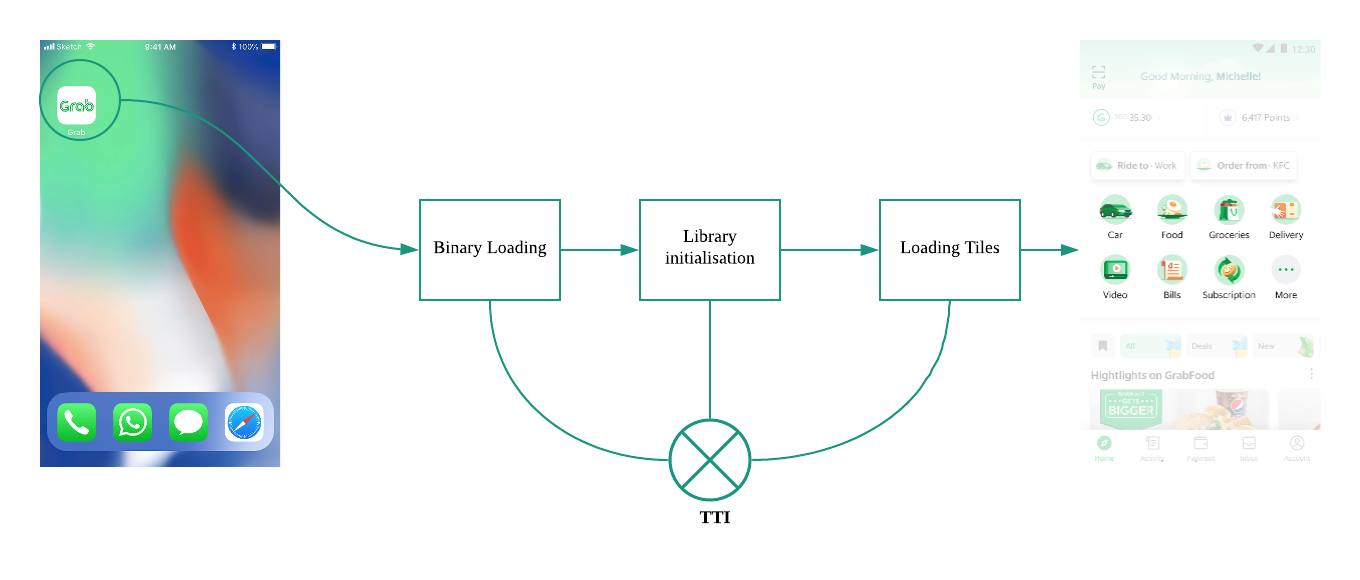
When the numbers started rolling in from production, we needed specific measurements to interpret those numbers, so we started looking at TTI’s 50th, 90th, and 95th percentile. A 90th percentile (p90) of x seconds means that 90% of the users have an interactive screen in at most x seconds.
We chose to only focus on p50 and p95 as these cover the majority of our users who deal with performance issues. Improving performance for <p50 (who already have high-end devices) would not bring too much of a value, and improving for >p95 would be very difficult as the app performance improvements will be limited by device performance.
By the end of January, we got the p50, p90, and p95 numbers for the contributing components that summed up to TTI numbers for tiles, which allowed us to start identifying areas with potential improvements.
Caching and Animation Removal
While reviewing the TTI numbers, we were drawn to contributors with high time consumption rates such as tile loading and app start animation. Other evident improvement we worked on was caching data between app launches instead of waiting for a network response for loading tiles at every single app launch.
Tile Caching
Based on the gathered data, the service tiles only change when a user travels between cities. This is because the available services vary in each city. Since users do not frequently change cities, the service tiles do not change very frequently either, and so caching the tiles made sense. However, we also needed to sync the fresh tiles, in case of any change. So, we updated the logic based on these findings. as illustrated in the following image:
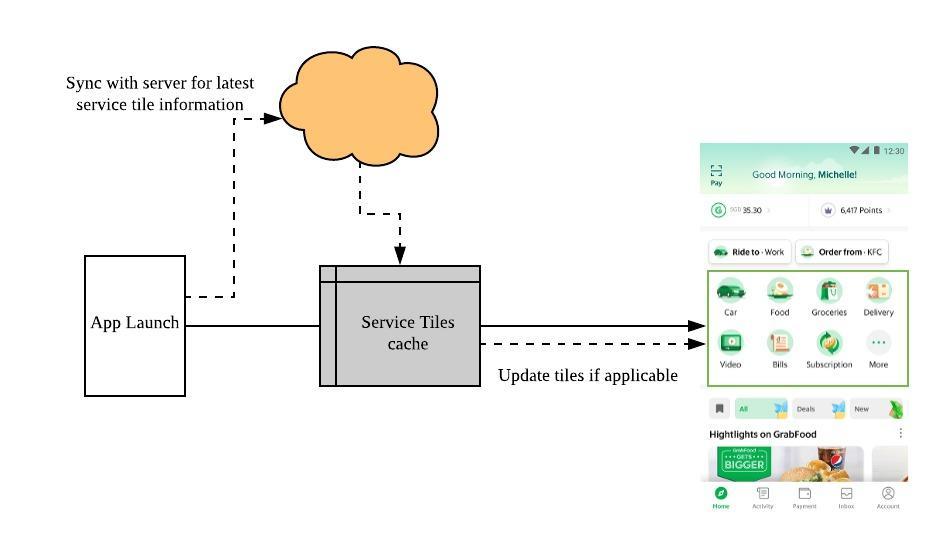
Caching tiles brought us a huge improvement of ~3s on each platform.
Animation Removal
We came across a beautifully created animation at appstart that didn’t provide any additional value in terms of information or practicality.
With detailed discussions and trade-offs with designers, we removed the animation and improved our TTI further by 1s.
In conclusion, with the caching and animation removal alone, we improved the TTI by 4s.
Welcome Static Linking and Coroutines
At this point, our users gained 4 seconds of their time back, but we didn’t want to stop with that number. So, we dug through the data to see what further enhancements we could do. When we could not find anything else that was similar to caching and animation removal, we shifted to architecture fundamentals.
We knew that this was not an easy route to take and that it would come with a cost; if we decided to choose a component related to architecture fundamentals, all the other teams working on the Grab app would be impacted. We had to evaluate our options and make decisions with trade-offs for overall improvements. And this eventually led to static linking on iOS and coroutines on Android.
Binary Loading
Binary loading is one of the first steps in both mobile platforms when an app is launched. It primarily contributes to pre-main and dex-loading, on iOS and Android respectively.
The pre-main time on iOS was about 7.9s. It is known in the iOS development world that each framework (binary) can either be dynamically or statically linked. While static helps in a faster app start, it brings complexity in building frameworks that are elaborate or contain resources bundles.Building a lot of libraries statically also impact build times negatively.With proper evaluations, we decided to take the route to enable more static linking due to the trade-offs.
Apple recommends a maximum of half a dozen dynamic frameworks for an optimal performance. Guess what? Our passenger app had 107 dynamically linked frameworks, a lot of them were internal.
The task looked daunting at first, since it affected all parts of the app, but we were ready to tackle the challenge head on. Deciding to take this on was the easy part, the actual work entailed lots of tricky coordination and collaboration with multiple teams.
We created an RFC (Request For Comments) doc to propose the static linking of frameworks, wherever applicable, and co-ordinated with teams with the agreed timelines to execute this change.
While collaborating with teams, we learned that we could remove 12 frameworks entirely that were no longer required. This exercise highlighted the importance of regular cleanup and deprecation in our codebase, and was added into our standard process.
And so, we were left with 95 frameworks; 75 of which were statically linked successfully, resulting in our p90 pre-main dropping by 41%.
As Grabbers, it’s in our DNA to push ourselves a little more. With the remaining 20 frameworks, our pre-main was still considerably high. Out of the 20 frameworks, 10 could not be statically linked without issues. As a workaround, we merged multiple dynamic frameworks into one. One of our outstanding engineers even created a plug-in for this, which is called the CocoaPods Merge. With this plug-in, we were able to merge 10 dynamically linked frameworks into 2. We’ve made this plug-in open source: https://github.com/grab/cocoapods-pod-merge.
With all of the above steps, we were finally left with 12 dynamic frameworks - a huge 88% reduction.
The following image illustrates the complex numbers mentioned above:
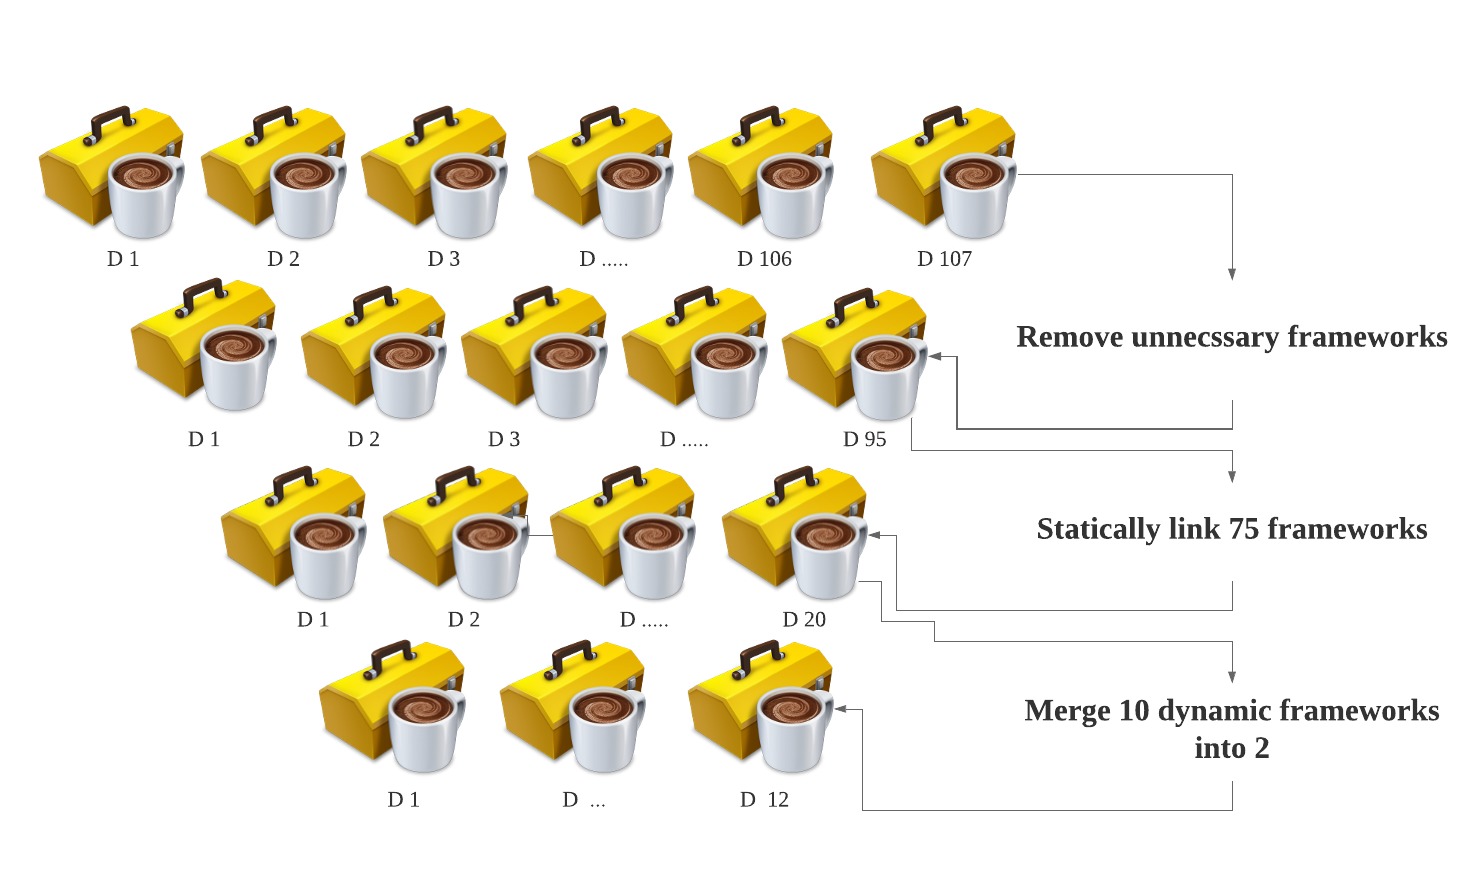
Using CocoaPods merge further helped us with ~0.8s of improvement.
Coroutines
While we were executing the static linking initiative on iOS, we also started refactoring the application initialisation for a modular and clean code on Android. This resulted in creating an ApplicationInitialiser class, which handles the entire application initialisation process with maximum parallelism using coroutines.
Now all the libraries are being initialised in parallel via coroutines and thus enabling better utilisations of computing resources and a faster TTI.
This refactoring and background initialisation for libraries on Android helped gain ~0.4s of improvements.
Changing the Basics - Visualisation Setup
By the end of H1 2019, we observed a 50% improvement in TTI, and now it was time to set new goals for H2 2019. Until this point, we would query our database for all metric numbers, copy the numbers into a spreadsheet, and compare them against weeks and app versions.
Despite the high loads of manual work and other challenges, this method still worked at the beginning due to the improvements we had to focus on.
However, in H2 2019 it became apparent that we had to reassess our methodology of reading numbers. So, we started thinking about other ways to present and visualise these numbers better. With help from our Product Analyst, we took advantage of metabase’s advanced capabilities and presented our goals and metrics in a clear and easy to understand format.
For example, here is a graph that shows the top contributing metrics for Android:
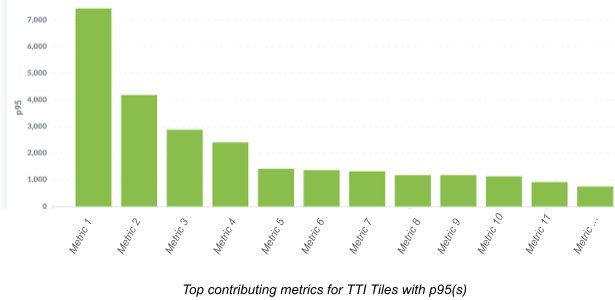
Looking at it, we could clearly tell which metric needed to be prioritised for improvements.
We did this not only for our metrics, but also for our main goals, which allowed us to easily see our progress and track our improvements on a daily basis.
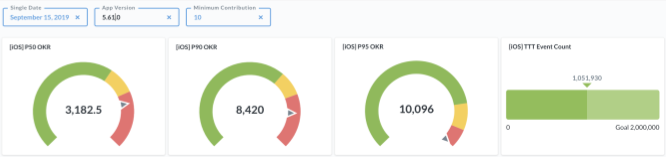
The colour bars in the above image depicts the status of our numbers against our goals and also shows the actual numbers at p50, p90, and p95.
As our tracking progressed, we started including more granular and precise measurements, to help guide the team and achieve more impactful improvements of around ~0.3-0.4s.
Fortunately, we were deprecating a third-party library for analytics and experimentation, which happened to be one of the highest contributing metrics for both platforms due to a high number of operations on the main thread. We started using our own in-house experimentation platform where we had better control over performance. We removed this third-party dependency, and it helped us with huge improvements of ~2.5s on Android and ~0.5-0.7s on iOS.
You might be wondering as to why there is such a big difference on the iOS and Android improvement numbers for this dependency. This was due to the setting user attributes operations that ran only in the Android codebase, which was performed on the main thread and took a huge amount of time. These were the times that made us realise that we should focus more on the consistency for both platforms, as well as to identify the third-party library APIs that are used, and to assess whether they are absolutely necessary.
*Tip*: So, it is time for you as well to eliminate such inconsistencies, if there are any.
Ok, there goes our third quarter with ~3s of improvement on Android and ~1.3s on iOS.
Performance Regression Detection
Entering into Q4 brought us many challenges as we were running out of improvements to make. Even finding an improvement worth ~0.05s was really difficult! We were also strongly challenged by regressions (increase in TTI numbers) because of continuous feature releases and code additions to the app start process.
So, maintaining the TTI numbers became our primary task for this period. We started looking into setting up processes to block regressions from being merged to the master, or at least get notified before they hit production.
To begin with, we identified the main sources of regressions: static linking breakage on iOS and library initialisation in the app startup process on Android.
We took the following measures to cover these cases:
Linters
We built linters on the Continuous Integration (CI) pipeline to detect potential changes in static linking on iOS and the ApplicationInitialiser class on Android. The linters block the change list and enforce a special review process for such changes.
Library Integration Process
The team also focused on setting up a process for library integrations, where each library (internal or third party) will first be evaluated for performance impact before it is integrated into the codebase.
While regression guarding was in process, we were simultaneously trying to bring in more improvements for TTI. We enabled the Link Time Optimisations (LTO) flag on iOS to improve the overall app performance. We also experimented on order files on iOS and anko layout on Android, but were ruled out due to known issues.
On Android, we hit the bottom hard as there were minimal improvements. Fortunately, it was a different story for iOS. We managed to get improvements worth ~0.6s by opting for lazy loading, optimising I/O operations, and deferring more operations to post app start (if applicable).
Next Steps
We will be looking at the different aspects of performance such as network, battery, and storage, while maintaining our current numbers for TTI.
- Network performance - Track the turnaround time for network requests then move on to optimisations.
- Battery performance - Focus on profiling the app for CPU and energy intensive operations, which drains the battery, and then move to optimisations.
- Storage performance - Review our caching and storage mechanisms, and then look for ways to optimise them.
In addition to these, we are also focusing on bringing performance initiatives for all the teams at Grab. We believe that performance is a collaborative approach, and we would like to improve the app performance in all aspects.
We defined different metrics to track performance e.g. Time to Interactive, Time to feedback (the time taken to get the feedback for a user action), UI smoothness indicators, storage, and network metrics.
We are enabling all teams to benchmark their performance numbers based on defined metrics and move on to a path of improvement.
Conclusion
Overall, we improved by 60%, and this calls for a big celebration! Woohoo! The bigger celebration came from knowing that we’ve improved our consumers’ experience in using our app.
This graph represents our performance improvement journey for the entire 2019, in terms of TTI.
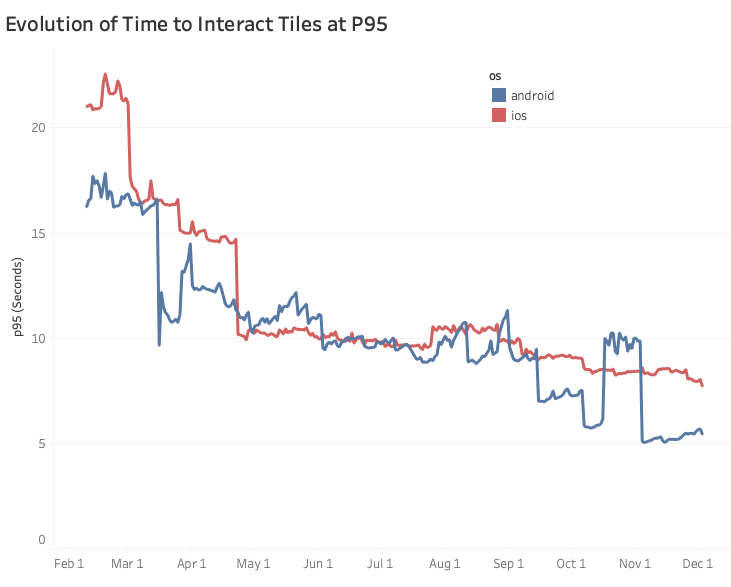
Based on the graph, looking at our p95 improvements and converting them to number of hours saved per day gives us ~21,388 hours on iOS and ~38,194 hours saved per day on Android.
Hey, did you know that it takes approximately 80-85 hours to watch all the episodes of Friends? Just saying. :)
We will continue to serve our consumers for a better and faster experience in the upcoming years.