The Curious Case of the Phantom Instance
Note: Timestamps used in this article are in UTC+8 Singapore time, unless stated otherwise.
Here at the Grab Engineering team, we have built our entire backend stack on top of Amazon Web Services (AWS). Over time, it was inevitable that some habits have started to form when perceiving our backend monitoring statistics.
Take a look at the following Datadog (DD) dashboard we have, which monitors the number of Elastic Load Balancer (ELB) health check requests sent to our grab_attention cluster:
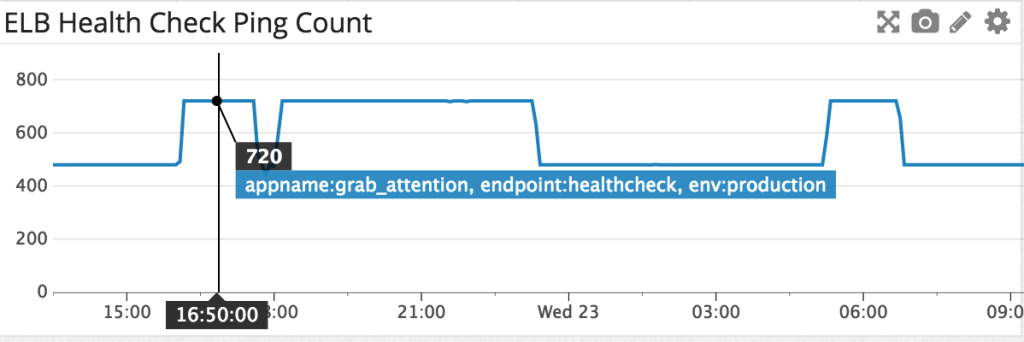
grab_attention is the tongue in cheek name for the in-app messaging API hostname.
Upon first look, the usual reflex conclusion for the step waveforms would be an Auto Scaling Group (ASG) scaling up event. After all, a new instance equates to a proportionate increase in health check requests from the ELB.
According to the graph shown, the values have jumped between 48 and 72 counts/min (the dashboard above collates in 10-minute intervals). The grab_attention ASG usually consists of 2 instances. 72 / 48 = 1.5, therefore there should have been an ASG scale up event at roughly 22 Dec 2015, 1610 hours.
Now, here’s the weird part. Our ASG activity history, interestingly, did not match up with the observed data:
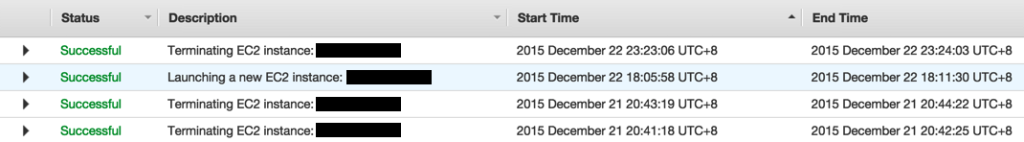
The only ASG scaling events on 22 Dec were, a scale up at 1805 hours and a scale down at 2306 hours, which explains the middle step up/down waveform.
So… where are the increased step ups in health checks on the two sides (22 Dec 16:10 - 17:45 & 23 Dec 05:15 - 06:50) coming from?
Further probing around in CloudWatch revealed that the ElastiCache (EC) NewConnections metric for the underlying Redis cluster mirrored the health check data:
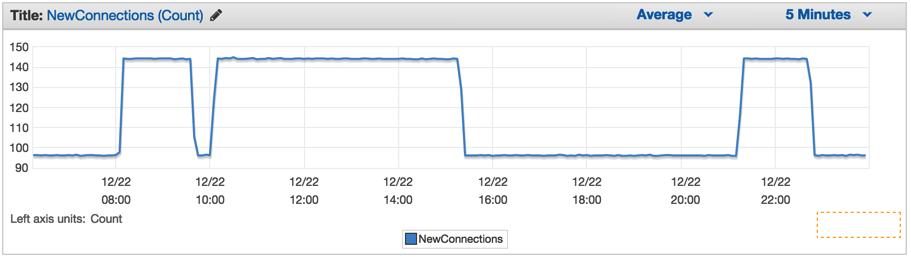
Metrics in UTC
The number of new connections made to the Redis cluster jumped between 96 and 144 at the identical moments of the ELB health check jumps; this is a similar 1.5 X increase in data. This seemed to clearly indicate a third instance, but no third IP address was found in the server logs.
We have on our hands a phantom instance that has been sending out ELB health check data to our DD, and creating new Redis connections that is nowhere to be found.
Fortunately, the engineering team had included the instance hostnames as one of the DD tags. Applying it gave the following dashboard:
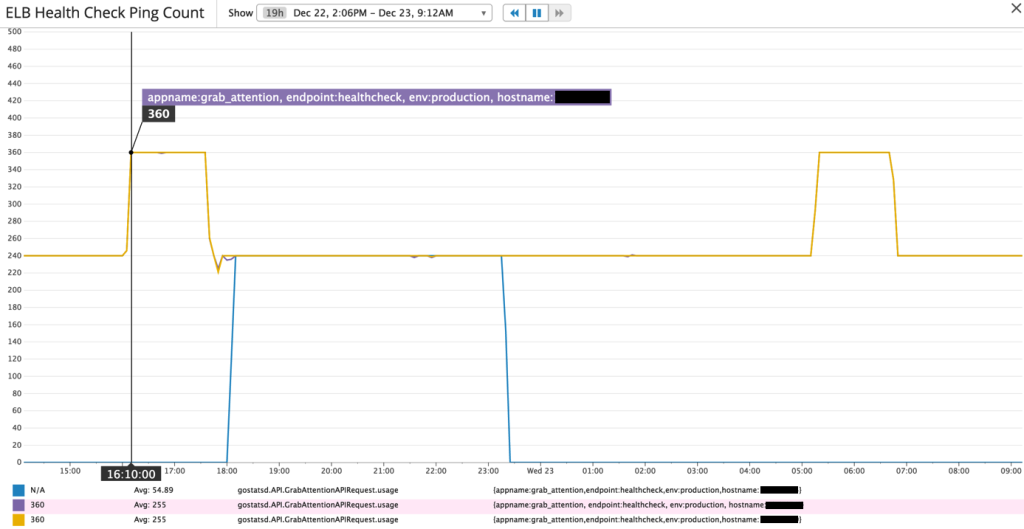
Surprise! While the middle step form was clearly contributed by the third instance spun up during an ASG scaling event, it would seem that the 2 similar step forms on each side were contributed only by the 2 existing instances. ELB health check ping counts to each of the instances jumped between 24 to 36 counts/min, a 1.5X increase.
AWS Support replied with the following response (UTC timestamps):
I have taken a look at your ELB and found that there was a ELB’s scaling event during the time like below. ELB Scaling up: 2015-12-22T08:07 ELB Scaling down: 2015-12-22T21:15 Basically, ELB nodes can be replaced(scaling up/down/out/in) anytime depends on your traffic, ELB nodes resource utilisation or their health. Also, to offer continuous service without an outage the procedure will be like below.
1) new ELB nodes are deployed,
2) put in a service,
3) old ELB node detached from ELB(once after the new ELB nodes are working fine)
4) old ELB node terminated
So, during the ELB scaling event, your backends could get more health checks from ELB nodes than usual and it is expected. You don’t have to worry for the increased number of health checks but when you get less number of health checks than your ELB configured value, it would be a problem. Hope this helps your concern and please let us know if you need further assistance.
The 2 mentioned scaling event timestamps coincide with the 2 step graphs on both sides, one for a scale up, and one for a scale down. Each step up lasted roughly 90 minutes. It was previously presumed that an increased number of nodes in ELB scaling would explain the increase in health checks. But that would not explain the increase in health checks for a scale down event. This seemed to indicate that the number of health checks would increase regardless of whether ELB scaling up or down.
Moreover, the health check interval isn’t something set to each node, but to the entire ELB itself. To top it off, why a 1.5X increase? Why not 2X or any other whole number?
A brief check of our configured health check interval revealed it to be 5 seconds. Which should yield:
1 min * 60 sec / 5s interval * 2 instances = 24 counts/min
If there was a 1.5X increase in counts during ELB scaling, it should have increased to a total of 36 counts/min. This did not match up to the DD dashboard metric of 48 counts/min to 72 counts/min.
Another round of scrolling through the list of ELBs gave the answer. 2 ELBs are actually being used for the grab_attention ASG cluster, one for public facing endpoints, and another for internal endpoints.
Embarrassingly, this had been totally forgotten about. The internal ELB was indeed configured to have a 5-second interval health check too.
Therefore, the calculation should be:
1 min * 60 sec / 5s interval * 2 ELBs * 2 instances = 48 counts/min
A scaling event occurring on the public facing ELB had in fact, doubled the number of health check counts for periods of ~90 minutes. Due to the internal ELB health check skewing the statistics sent to DD, it seemed like a third instance was spun up.
So… why did a similar graph shape appear in the EC New Connections CloudWatch metrics?
This code snippet was in the health check code:
if err := gredis.HealthCheck(config.GrabAttention.Redis); err != nil {
  logging.Error(logTag, "health check Redis error %v", err)
  return err
}
It turned out that, because each health check request opens a new ping pong connection to the Redis cluster (which didn’t use the existing Redis connection pool), the increase in the ELB health checks also led to a proportionate increase in new Redis connections.
A second response from AWS Support verifies the findings:
When the ELB scales up/down, it will replace nodes with bigger/smaller nodes. The older nodes, are not removed immediately. The ELB will remove the old nodes IP addresses from the ELB DNS endpoint, to avoid clients hitting the old nodes, however we still keep the nodes running for a while in case some clients are caching the IP addresses of the old nodes. While these nodes are running they are also performing health checks, that’s why the number of sample count doubles between 21:20 to 22:40. The ELB scaled down at 21:15, adding new smaller nodes. For a period of approximately 90 minutes new and old nodes were coexisting until they were removed.
In essence, contrary to a typical ASG scaling event where instances are launched or terminated, an ELB scaling event is possibly a node cluster replacement! Both clusters exist for 90 minutes before the old one gets terminated, or so it seemed. Then AWS Support replied one last time:
Scaling events do not necessarily imply node replacement. At some point the ELB could have more nodes, hence, you will have more health checks performed against your backends.
Conclusion
A series of coincidental ELB scaling events strictly involving node replacements had occurred, leading us to believe that a phantom instance had been spun up.
What We can Learn from This
It might be wise to separate dependency health checks within the instances from the ELB health checks, since it actually doubles the number of requests.
Don’t always assume the same, predictable graph changes are always the result of the same causes.
There is always something new about ELB to be learnt.