 Engineering
Dealing with the Meltdown Patch at Grab

Grab is more than just the leading ride-hailing and mobile payments platform in Southeast Asia. We use data and technology to improve everything from transportation to payments across a region of more than 620 million people.
The meltdown attack reported recently had far reaching implications in terms of security as well as performance. This post is a quick rundown of what performance impacts we noted as well as how we went on to mitigate them.
Most of our infrastructure runs on AWS. Initially, the only indicators we had were the slightly more than usual EC2 maintenance notices sent by AWS. However, as most of our EC2 fleet is stateless, we were able to simply terminate the required instances and spin up new ones. All the instances run on HVM across a variety of instance types running multiple Golang and Ruby applications and we didn’t notice any performance impact.
The one place where we did notice a performance impact was on Elasticache. We use Elasticache, the managed service offered by AWS, to run hundreds of Redis nodes. These Redis instances are used by services in multiple ways and we run both the clustered version as well as the non-clustered version.
On January 3rd, our automatic alerting triggered at around noon for high CPU utilisation on one of our critical Redis nodes. The CPU utilisation had jumped from around 36% to 76%. Now those numbers don’t look too bad until you realise that this is an m4.large instance which means it has 2 vCPUs. Combined with the fact that Redis is single-threaded, whenever we see CPU utilisation go past 50% it’s a cause for concern.
The initial suspicions were a deployment / workload change causing the spike and our initial investigations focused on that. However, over the course of a few hours, multiple unrelated Redis nodes started displaying the exact same behaviour with sudden significant spikes in CPU utilisation.
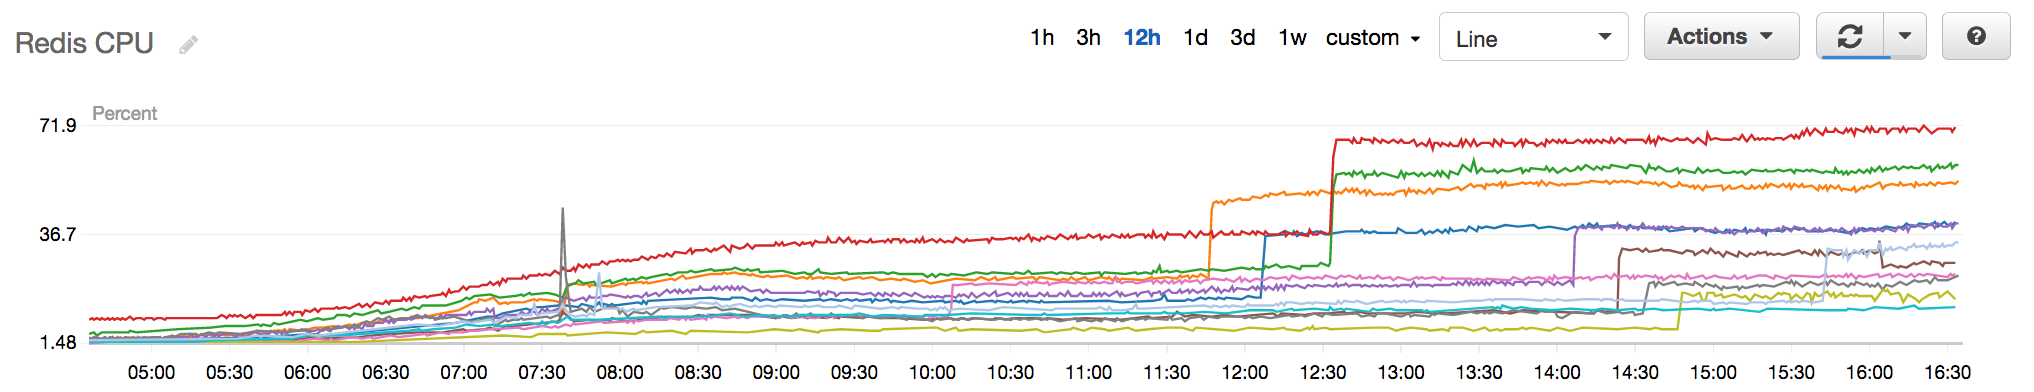 Fig 1. Redis CPU Utilisation
Notice the multiple sudden steep spikes in CPU utilisation and then plateauing as time goes on.
Some of the Redis with CPU utilisation spikes were the replica nodes in the multi-az setup. As most services were having these replicas purely for HA and not actively using them, having the CPU utilisation on it spike without the master node spiking indicated that it was no longer a workload issue. At this point, we escalated to AWS with the data in hand.
Later that night, we then attempted to perform Multi-AZ Failovers for certain nodes where the master had exhibited a spike but the replica hadn’t. Our suspicions at this time was that there was some underlying hardware issue and failing over to a node that wasn’t affected would help us. It was successful as once the replica became the master the CPU utilisation went down to the original levels. We performed this operation for multiple nodes and then called it a night confident we’ve mitigated the problem.
Alas, our success was short-lived as the example graph below shows.
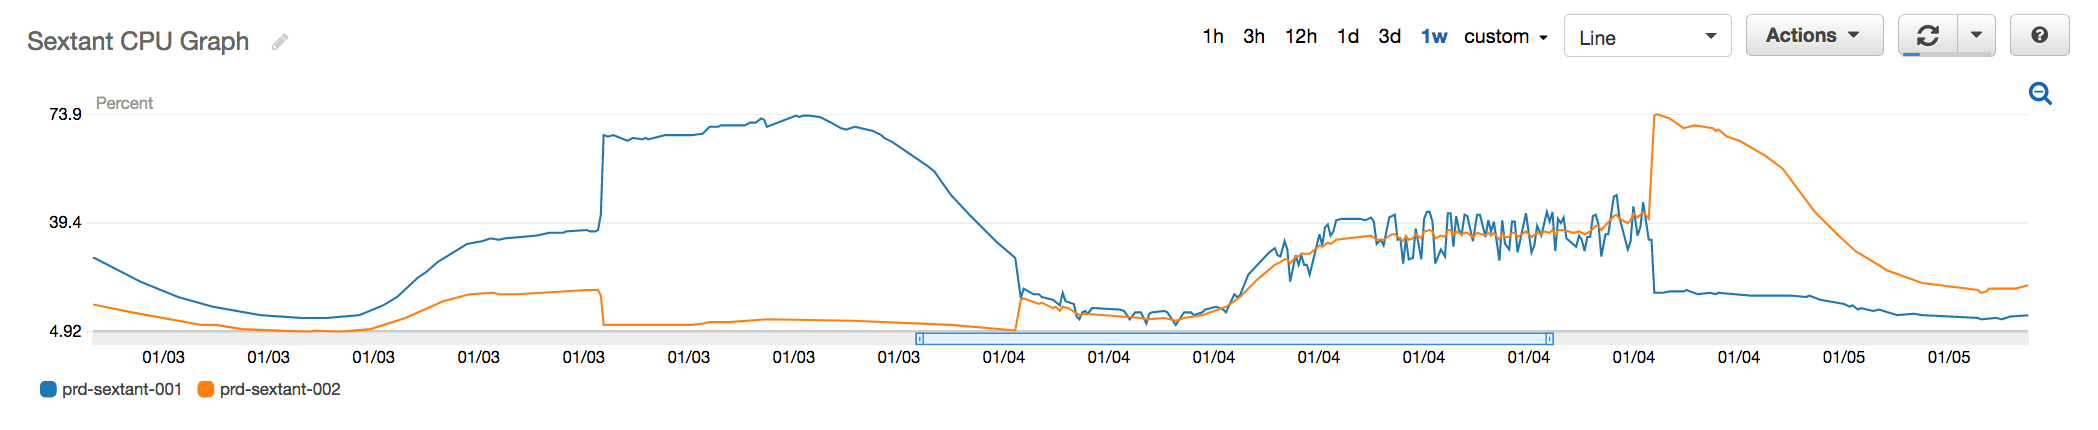 Fig 2. CPU Utilisation of an affected Redis instance
Initially, prd-sextant-001 was the master and 002 was the replica. At noon on the 3rd, you see the CPU spike on master, the corresponding drop on the replica is still unexplained (The hypothesis is that a percentage of updates failed on the master node resulting in a smaller set of changes to be replicated). Early in the morning on the 4th is when we performed the failover, you see 002 now having utilisation equal to 001. On the evening of the 4th, however, you see that 002 has its CPU utilisation significantly spiked up.
With information released from AWS that the EC2 maintenance was related to meltdown and benchmarks being released about the performance impact of the patches, the two were put together as the possible explanation of what we were seeing. AWS could be performing rolling patches to the Elasticache nodes. As a node gets patched the CPU spikes and our failovers were only successful in reducing the utilisation because we were failing over to a node that wasn’t yet patched. However, once that node got patched the CPU would spike again.
Realising that this was now going to be the expected performance the teams quickly sprung into action on how to best spread the load.
Clustered Redis
We would add additional shards so that the load gets spread evenly. This was complicated by the fact that we were running on the engine version 3.2.4 which didn’t support live re-sharding so we had to spin up a lot of new clusters with the additional shards, ensure that the cache gets warmed up before switching completely over and decommissioning the old one.
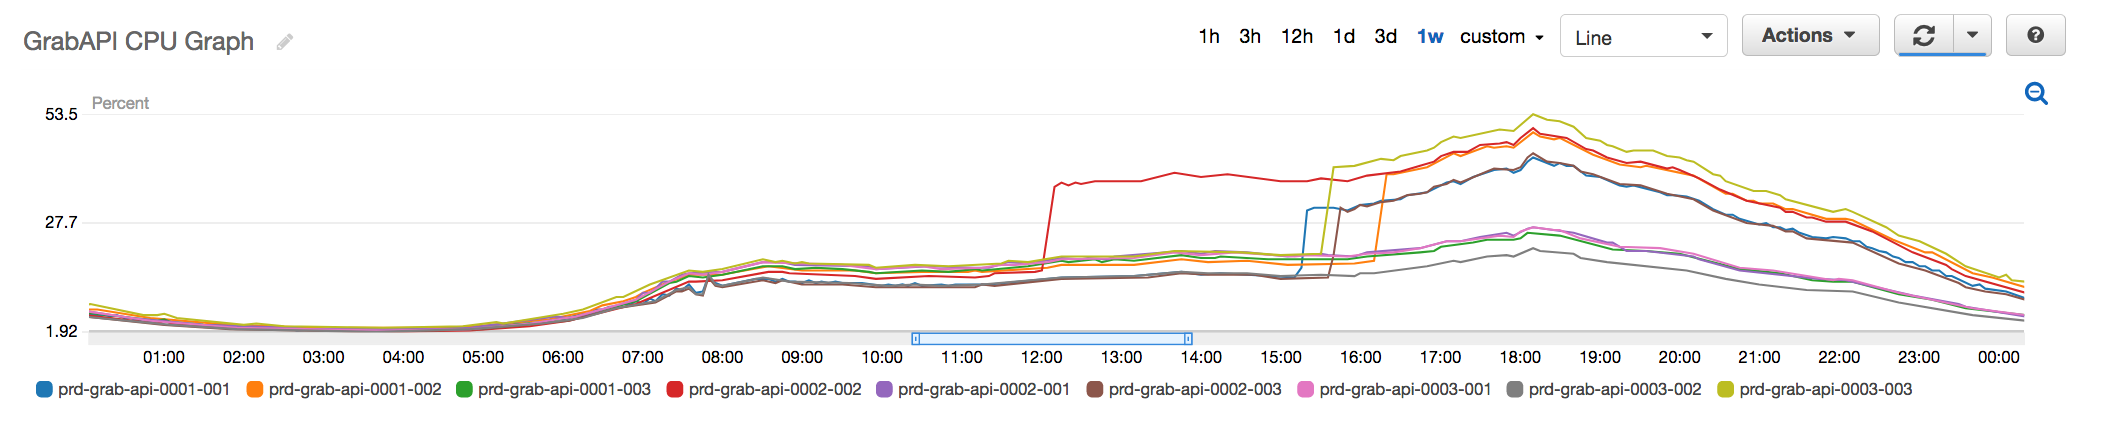 Fig 3. Old API Redis Cluster with nodes going up to 50% peak CPU
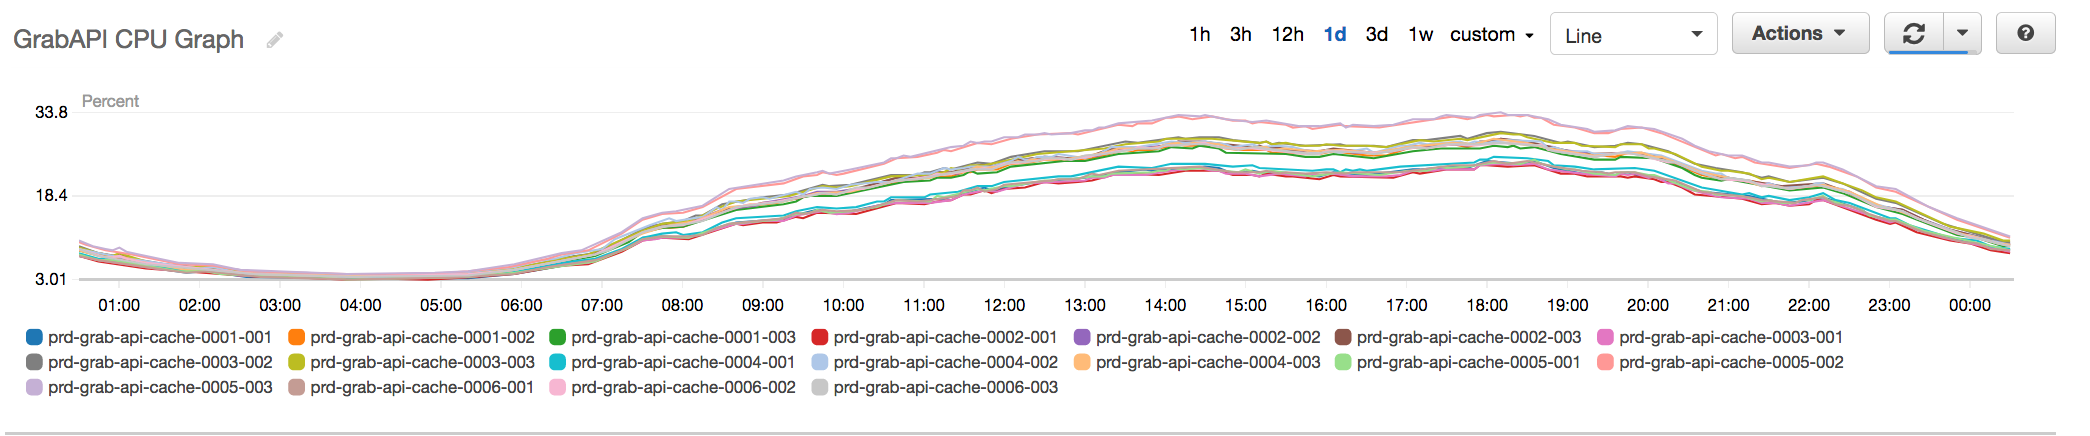 Fig 4. New API Redis Cluster with additional shards now hovering at about 30% peak CPU
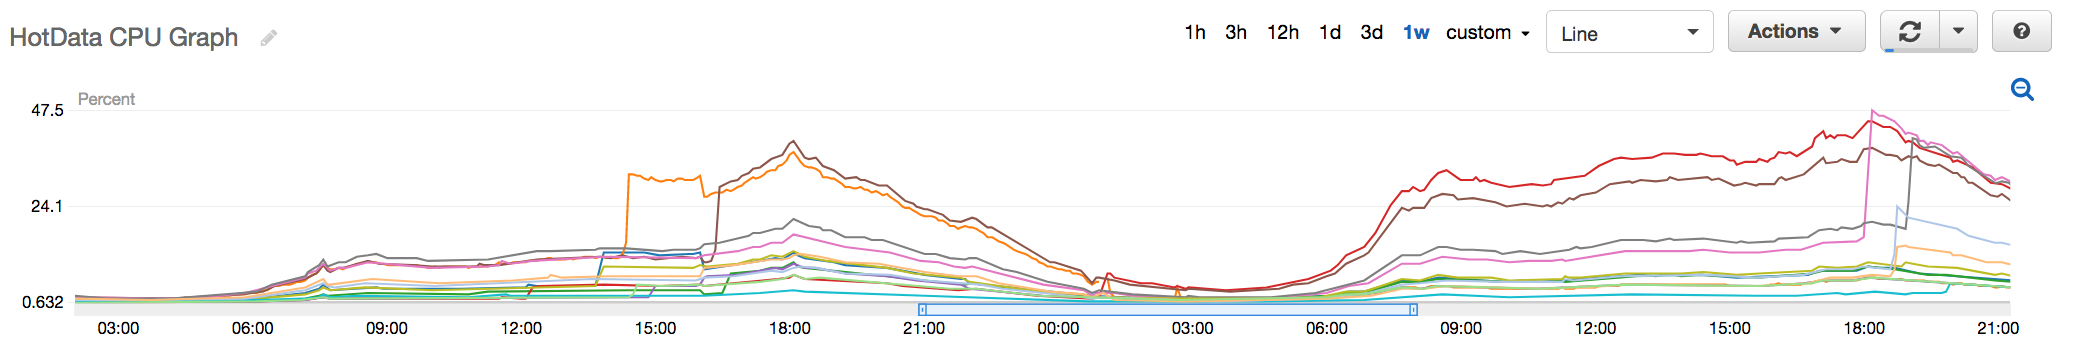 Fig 5. Old Hot Data Redis Cluster with CPU peaking at around 48%
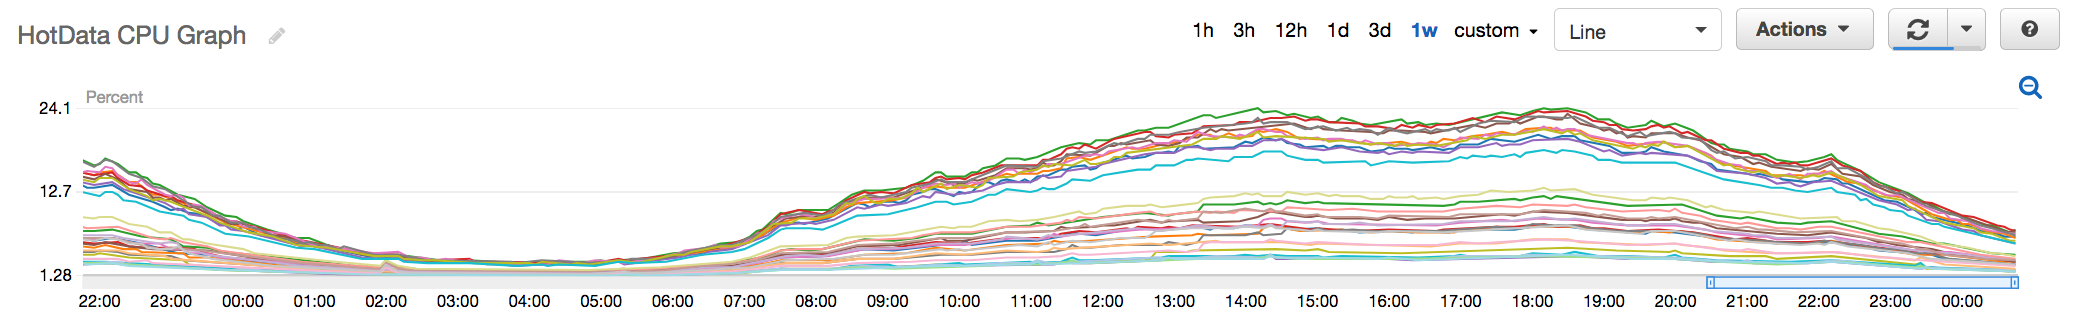 Fig 6. New Hot Data Redis Cluster with CPU peaking at around 24%
Non-Clustered Redis
-
Some of our systems were already designed to use multiple Redis nodes. So provisioning additional nodes and updating the configs to start using these nodes was the easiest solution.
-
For certain Redis nodes that were able to utilise Redis Cluster with minimal code change, we switched them to use Redis Cluster.
-
The final few Redis nodes, the service teams made significant code changes so that they could shard the data onto multiple nodes.
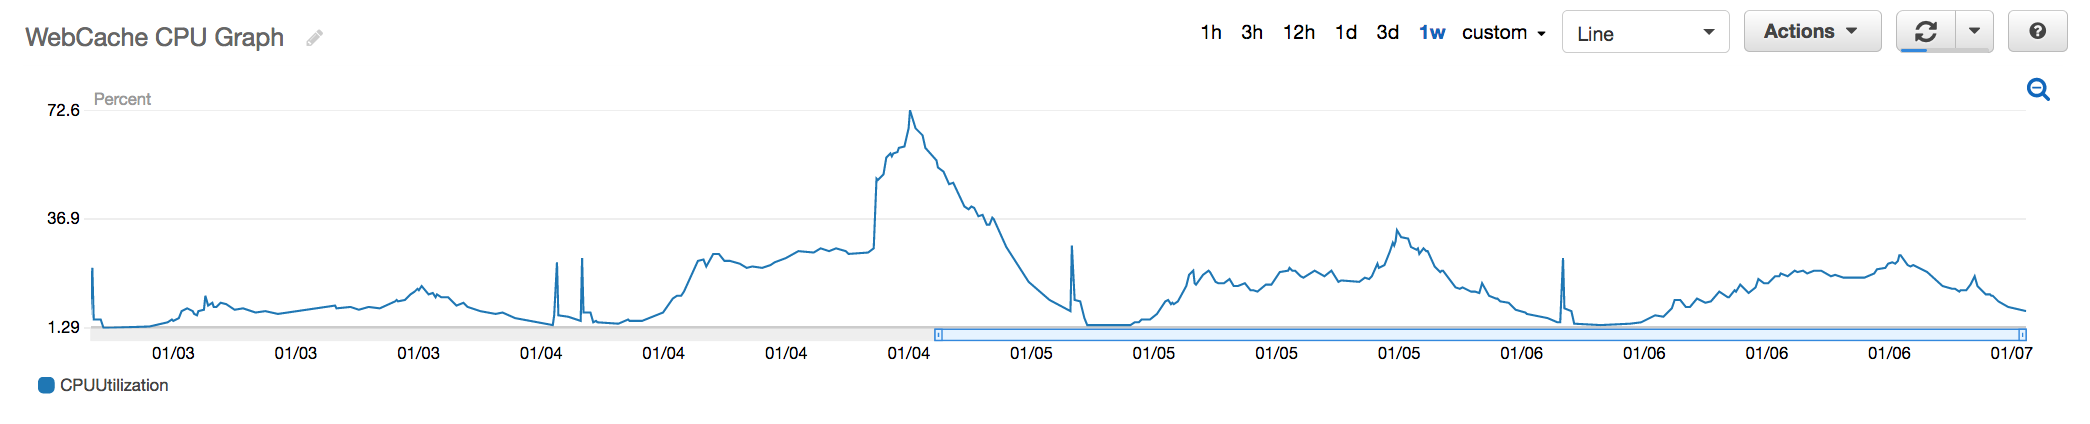 Fig 7. Redis where code changes were made to shard the data across multiple nodes to reduce the overall load on a single critical node
All of these mitigations were done over a period of 24 hours to ensure that we go past our Friday peak (our highest traffic point during the week) without any consumer facing impact.
Conclusion
This post was meant to give a quick glimpse of the impact that Meltdown has had at Grab as well as provide some real data on the performance impact of the patches.
The design of our internal systems in their usage of Redis to quickly be able to horizontally scale-out was key in ensuring that there was minimal impact, if any to our consumers.
We still have further investigation to conduct to truly understand why only certain Redis workloads were affected while others weren’t. We are planning to dive deeper into this and that may be the subject of a future blog post.