 Engineering
Protecting Personal Data in Grab's Imagery
Image Collection Using KartaView
A few years ago, we realised a strong demand to better understand the streets where our driver-partners and consumers go, with the purpose to better fulfil their needs and also, to quickly adapt ourselves to the rapidly changing environment in the Southeast Asian cities.
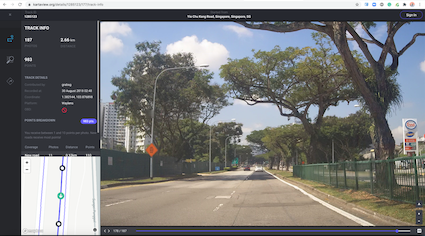
One way to fulfil that demand was to create an image collection platform named KartaView which is Grab Geo’s platform for geotagged imagery. It empowers collection, indexing, storage, retrieval of imagery, and map data extraction.
KartaView is a public, partially open-sourced product, used both internally and externally by the OpenStreetMap community and other users. As of 2021, KartaView has public imagery in over 100 countries with various coverage degrees, and 60+ cities of Southeast Asia. Check it out at here.
Why Image Blurring is Important
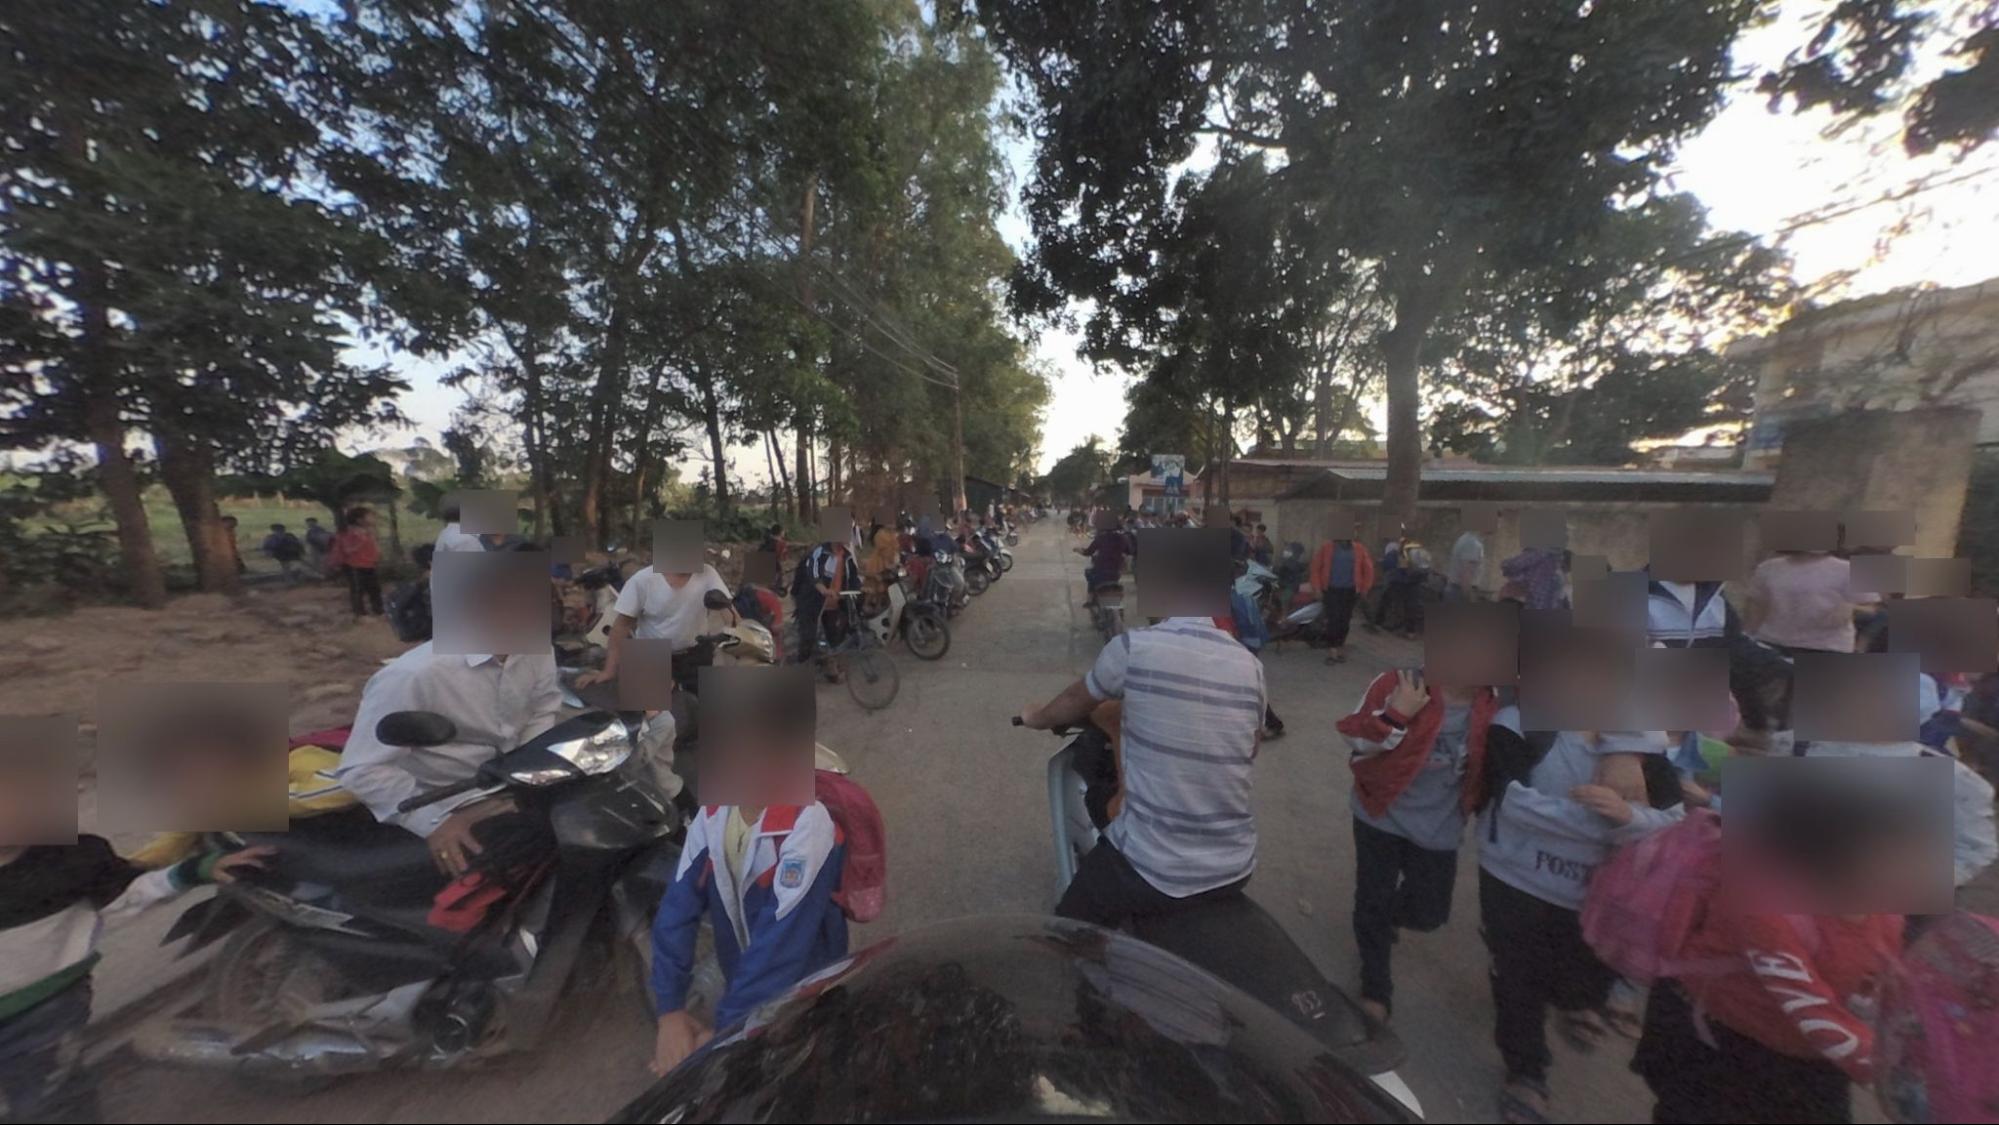
Incidentally, many people and licence plates are in the collected images, whose privacy is a serious concern. We deeply respect all of them and consequently, we are using image obfuscation as the most effective anonymisation method for ensuring privacy protection.
Because manually annotating the regions in the picture where faces and licence plates are located is impractical, this problem should be solved using machine learning and engineering techniques. Hence we detect and blur all faces and licence plates which could be considered as personal data.

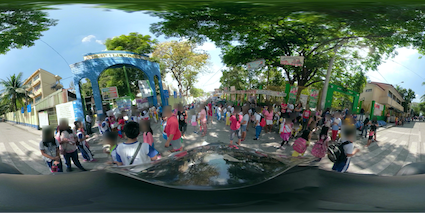
In our case, we have a wide range of picture types: regular planar, very wide and 360 pictures in equirectangular format collected with 360 cameras. Also, because we are collecting imagery globally, the vehicle types, licence plates, and human environments are quite diverse in appearance, and are not handled well by off-the-shelf blurring software. So we built our own custom blurring solution which yielded higher accuracy and better cost efficiency overall with respect to blurring of personal data.
Behind the scenes, in KartaView, there are a set of cool services which can derive useful information from the pictures like image quality, traffic signs, roads, etc. A big part of them are using deep learning algorithms which potentially can be negatively affected by running them over blurred pictures. In fact, based on the assessment we have done so far, the impact is extremely low, similar to the one reported in a well known study of face obfuscation in ImageNet 1.
Outline of Grab’s Blurring Process
At a high level, this is how Grab goes about the blurring process:
- Transform each picture into a set of planar images. In this way, we further process all pictures, whatever the format they had, in the same way.
- Use an object detector able to detect all faces and licence plates in a planar image having a standard field of view.
- Transform the coordinates of the detected regions into original coordinates and blur those regions.

2 In the following section, we are going to describe in detail the interesting aspects of the second step, sharing the challenges and how we were solving them. Let’s start with the first and most important part, the dataset.
Dataset
Our current dataset consists of images from a wide range of cameras, including normal perspective cameras from mobile phones, wide field of view cameras and also 360 degree cameras.
It is the result of a series of data collections contributed by Grab’s data tagging teams, which may contain 2 classes of dataset that are of interest for us: FACE and LICENSE_PLATE.
The data was collected using Grab internal tools, stored in queryable databases, making it a system that gives the possibility to revisit and correct the data if necessary, but also making it possible for data engineers to select and filter the data of interest.
Dataset Evolution
Each iteration of the dataset was made to address certain issues discovered while having models used in a production environment and observing situations where the model lacked in performance.
| Dataset v1 | Dataset v2 | Dataset v3 | |
|---|---|---|---|
| Nr. images | 15226 | 17636 | 30538 |
| Nr. of labels | 64119 | 86676 | 242534 |
If the first version was basic, containing a rough tagging strategy we quickly noticed that it was not detecting some special situations that appeared due to the pandemic situation: people wearing masks.
This led to another round of data annotation to include those scenarios. The third iteration addressed a broader range of issues:
- Small regions of interest (objects far away from the camera)
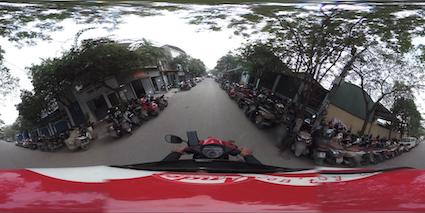
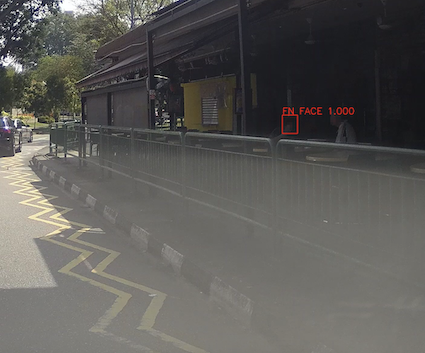
- Objects in very dark backgrounds
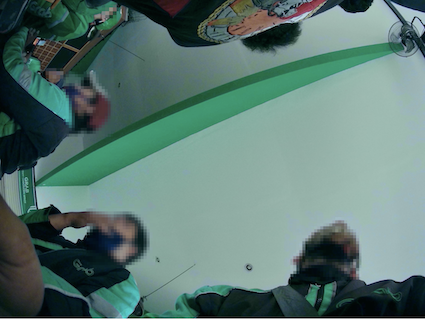
- Rotated objects or even upside down
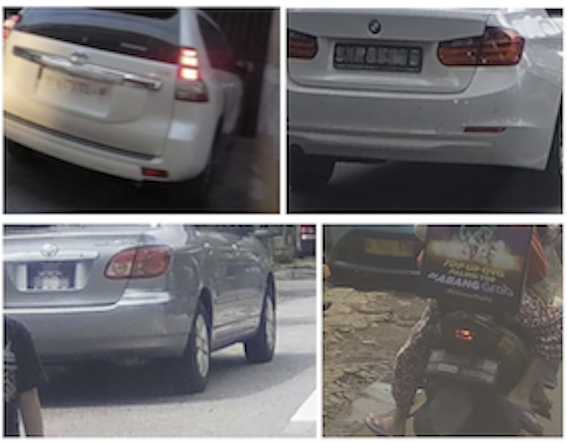
- Variation of the licence plate design due to images from different countries and regions
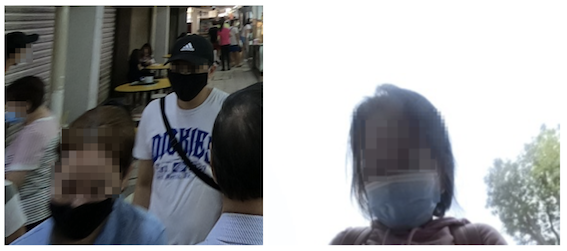
- People wearing masks
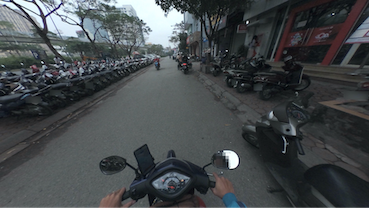
- Faces in the mirror - see below the mirror of the motorcycle
- But the main reason was because of a scenario where the recording had at the start or end (but not only) close-ups of the operator who was checking the camera. This led to images with large regions of interest containing the camera operator’s face - too large to be detected by the model.

We investigated the dataset structure by splitting the data into bins based on the bbox sizes (in pixels). This made something clear to us: the dataset was unbalanced.
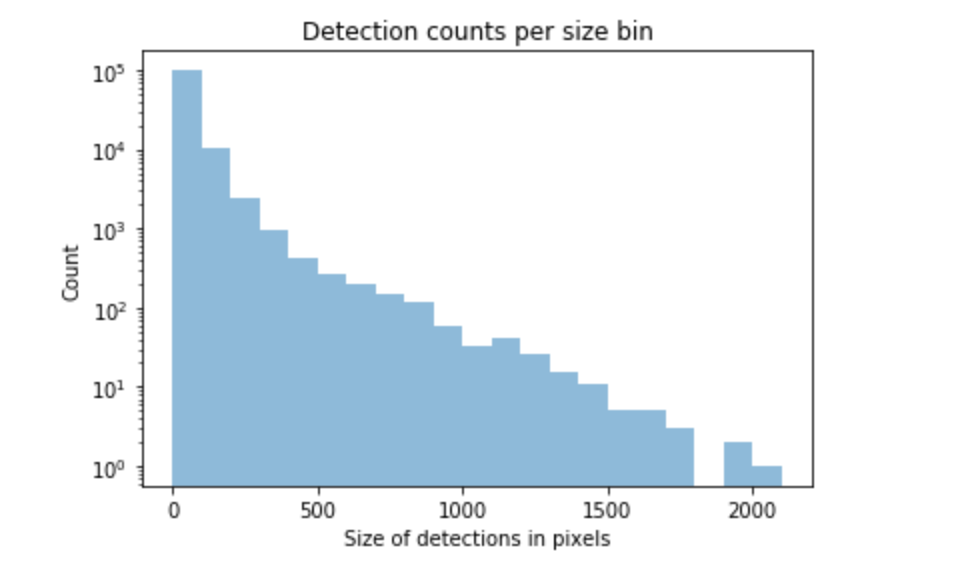
We made bins for tag sizes with a stride of 100 pixels and went up to the maximum value present in the dataset which accounted for 1 sample of size 2000 pixels. The majority of the labels were small in size and the higher we would go with the size, the fewer tags we would have. This made it clear that we would need more targeted annotations for our dataset to try to balance it.
All these scenarios required the tagging team to revisit the data multiple times and also change the tagging strategy by including more tags that were considered at a certain limit. It also required them to pay more attention to small details that may have been missed in a previous iteration.
Data Splitting
To better understand the strategy chosen for splitting the data, we also need to understand the source of the data. The images come from different devices that are used in different geographical locations (different countries) and are from a continuous trip recording. The annotation team used an internal tool to visualise the trips image by image and mark the faces and licence plates present in them. We would then have access to all those images and their respective metadata.
The chosen ratios for splitting are:
- Train 70%
- Validation 10%
- Test 20%
| Number of train images | 12733 |
| Number of validation images | 1682 |
| Number of test images | 3221 |
| Number of labelled classes in train set | 60630 |
| Number of labelled classes in validation set | 7658 |
| Number of of labelled classes in test set | 18388 |
The split is not so trivial as we have some requirements and need to complete some conditions:
- An image can have multiple tags from one or both classes but must belong to just one subset.
- The tags should be split as close as possible to the desired ratios.
- As different images can belong to the same trip in a close geographical relation, we need to force them in the same subset. By doing so, we avoid similar tags in train and test subsets, resulting in incorrect evaluations.
Data Augmentation
The application of data augmentation plays a crucial role while training the machine learning model. There are mainly three ways in which data augmentation techniques can be applied:
- Offline data augmentation - enriching a dataset by physically multiplying some of its images and applying modifications to them.
- Online data augmentation - on the fly modifications of the image during train time with configurable probability for each modification.
- Combination of both offline and online data augmentation.
In our case, we are using the third option which is a combination of both.
The first method that contributes to offline augmentation is a method called image view splitting. This is necessary for us due to different image types: perspective camera images, wide field of view images, 360 degree images in equirectangular format. All these formats and field of views with their respective distortions would complicate the data and make it hard for the model to generalise it and also handle different image types that could be added in the future.
For this, we defined the concept of image views which are an extracted portion (view) of an image with some predefined properties. For example, the perspective projection of 75 by 75 degrees field of view patches from the original image.
Here we can see a perspective camera image and the image views generated from it:
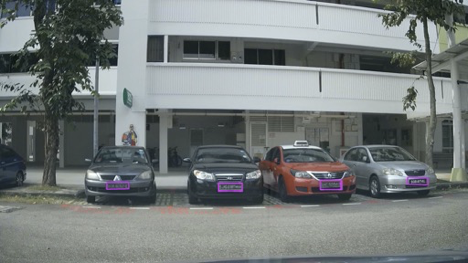
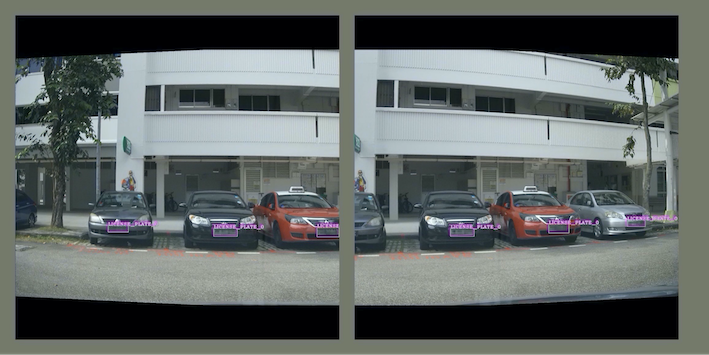
The important thing here is that each generated view is an image on its own with the associated tags. They also have an overlapping area so we have a possibility to contain the same tag in two views but from different perspectives. This brings us to an indirect outcome of the first offline augmentation.
The second method for offline augmentation is the oversampling of some of the images (views). As mentioned above, we faced the problem of an unbalanced dataset, specifically we were missing tags that occupied high regions of the image, and even though our tagging teams tried to annotate as many as they could find, these were still scarce.
As our object detection model is an anchor-based detector, we did not even have enough of them to generate the anchor boxes correctly. This could be clearly seen in the accuracy of the previous trained models, as they were performing poorly on bins of big sizes.
By randomly oversampling images that contained big tags, up to a minimum required number, we managed to have better anchors and increase the recall for those scenarios. As described below, the chosen object detector for blurring was YOLOv4 which offers a large variety of online augmentations. The online augmentations used are saturation, exposure, hue, flip and mosaic.
Model
As of summer of 2021, the “go to” solution for object detection in images are convolutional neural networks (CNN), being a mature solution able to fulfil the needs efficiently.
Architecture
Most CNN based object detectors have three main parts: Backbone, Neck and (Dense or Sparse Prediction) Heads. From the input image, the backbone extracts features which can be combined in the neck part to be used by the prediction heads to predict object bounding-boxes and their labels.

3 The backbone is usually a CNN classification network pretrained on some dataset, like ImageNet-1K. The neck combines features from different layers in order to produce rich representations for both large and small objects. Since the objects to be detected have varying sizes, the topmost features are too coarse to represent smaller objects, so the first CNN based object detectors were fairly weak in detecting small sized objects. The multi-scale, pyramid hierarchy is inherent to CNNs so Tsung-Yi Lin et al 4 introduced the Feature Pyramid Network which at marginal costs combines features from multiple scales and makes predictions on them. This or improved variants of this technique is used by most detectors nowadays. The head part does the predictions for bounding boxes and their labels.
YOLO is part of the anchor-based one-stage object detectors family being developed originally in Darknet, an open source neural network framework written in C and CUDA. Back in 2015, it was the first end-to-end differentiable network of this kind that offered a joint learning of object bounding boxes and their labels.
One reason for the big success of newer YOLO versions is that the authors carefully merged new ideas into one architecture, the overall speed of the model being always the north star.
YOLOv4 introduces several changes to its v3 predecessor:
- Backbone - CSPDarknet53: YOLOv3 Darknet53 backbone was modified to use Cross Stage Partial Network (CSPNet 5) strategy, which aims to achieve richer gradient combinations by letting the gradient flow propagate through different network paths.
- Multiple configurable augmentation and loss function types, so called “Bag of freebies”, which by changing the training strategy can yield higher accuracy without impacting the inference time.
- Configurable necks and different activation functions, they call “Bag of specials”.
Insights
For this task, we found that YOLOv4 gave a good compromise between speed and accuracy as it has doubled the speed of a more accurate two-stage detector while maintaining a very good overall precision/recall. For blurring, the main metric for model selection was the overall recall, while precision and intersection over union (IoU) of the predicted box comes second as we want to catch all personal data even if some are wrong. Having a multitude of possibilities to configure the detector architecture and train it on our own dataset we conducted several experiments with different configurations for backbones, necks, augmentations and loss functions to come up with our current solution.
We faced challenges in training a good model as the dataset posed a large object/box-level scale imbalance, small objects being over-represented in the dataset. As described in 6 and 4, this affects the scales of the estimated regions and the overall detection performance. In 6 several solutions are proposed for this out of which the SPP 7 blocks and PANet 8 neck used in YOLOv4 together with heavy offline data augmentation increased the performance of the actual model in comparison to the former ones.
As we have evaluated, the model still has some issues:
- Occlusion of the object, either by the camera view, head accessories or other elements:
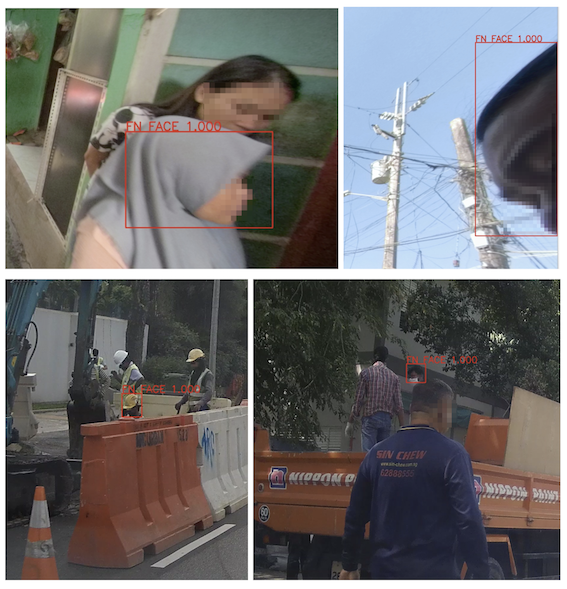
These cases would need extra annotations in the dataset, just like the faces or licence plates that are really close to the camera and occupy a large region of interest in the image.
- As we have a limited number of annotations of close objects to the camera view, the model has incorrectly learnt this, sometimes producing false positives in these situations:

Again, one solution for this would be to include more of these scenarios in the dataset.
What’s Next?
Grab spends a lot of effort ensuring privacy protection for its users so we are always looking for ways to further improve our related models and processes.
As far as efficiency is concerned, there are multiple directions to consider for both the dataset and the model. There are two main factors that drive the costs and the quality: further development of the dataset for additional edge cases (e.g. more training data of people wearing masks) and the operational costs of the model.
As the vast majority of current models require a fully labelled dataset, this puts a large work effort on the Data Entry team before creating a new model. Our dataset increased 4x for its third version, but still there is room for improvement as described in the Dataset section.
As Grab extends its operations in more cities, new data is collected that has to be processed, this puts an increased focus on running detection models more efficiently.
Directions to pursue to increase our efficiency could be the following:
- As plenty of unlabelled data is available from imagery collection, a natural direction to explore is self-supervised visual representation learning techniques to derive a general vision backbone with superior transferring performance for our subsequent tasks as detection, classification.
- Experiment with optimisation techniques like pruning and quantisation to get a faster model without sacrificing too much on accuracy.
- Explore new architectures: YOLOv5, EfficientDet or Swin-Transformer for Object Detection.
- Introduce semi-supervised learning techniques to improve our model performance on the long tail of the data.
Join us
Grab is a leading superapp in Southeast Asia, providing everyday services that matter to consumers. More than just a ride-hailing and food delivery app, Grab offers a wide range of on-demand services in the region, including mobility, food, package and grocery delivery services, mobile payments, and financial services across over 400 cities in eight countries.
Powered by technology and driven by heart, our mission is to drive Southeast Asia forward by creating economic empowerment for everyone. If this mission speaks to you, join our team today!
References
- Bharat Singh, Larry S. Davis. An Analysis of Scale Invariance in Object Detection - SNIP. arXiv:1711.08189v2
- Zhenda Xie et al. Self-Supervised Learning with Swin Transformers. arXiv:2105.04553v2
Footnotes
-
Kaiyu Yang et al. Study of Face Obfuscation in ImageNet: arxiv.org/abs/2103.06191 ↩
-
Nitish S. Mutha How to map Equirectangular projection to Rectilinear projection ↩
-
Alexey Bochkovskiy et al.. YOLOv4: Optimal Speed and Accuracy of Object Detection. arXiv:2004.10934v1 ↩
-
Tsung-Yi Lin et al. Feature Pyramid Networks for Object Detection. arXiv:1612.03144v2 ↩ ↩2
-
Chien-Yao Wang et al. CSPNet: A New Backbone that can Enhance Learning Capability of CNN. arXiv:1911.11929v1 ↩
-
Kemal Oksuz et al.. Imbalance Problems in Object Detection: A Review. arXiv:1909.00169v3 ↩ ↩2
-
Kaiming He et al. Spatial Pyramid Pooling in Deep Convolutional Networks for Visual Recognition. arXiv:1406.4729v4 ↩
-
Shu Liu et al. Path Aggregation Network for Instance Segmentation. arXiv:1803.01534v4 ↩
