Querying Big Data in Real-time with Presto & Grab's TalariaDB
Introduction
Enabling the millions and millions of transactions and connections that take place every day on our platform requires data-driven decision making. And these decisions need to be made based on real-time data. For example, an experiment might inadvertently cause a significant increase of waiting time for riders.
Without the right tools and setup, we might only know the reason for this longer waiting time much later. And that would negatively impact our driver-partners’ livelihoods and our consumers’ Grab experience.
To overcome the challenge of retrieving information from large amounts of data, our first step was to adopt the open-source Facebook’s Presto, that makes it possible to query petabytes with plain SQL. However, given our many teams, tools, and data sources, we also needed a way to reliably ingest and disperse data at scale throughout our platform.
To cope with our data’s scale and velocity (how fast data is coming in), we built two major systems:
-
McD: Our scalable data ingestion and augmentation service.
-
TalariaDB: A custom data store used, along with Presto and S3, by a scalable data querying engine.
In this article, we focus on TalariaDB, a distributed, highly available, and low latency time-series database that stores real-time data. For example, logs, metrics, and click streams generated by mobile apps and backend services that use Grab’s Experimentation Platform SDK. It “stalks” the real-time data feed and only keeps the last one hour of data.
TalariaDB addresses our need to query at least 2-3 terabytes of data per hour with predictable low query latency and low cost. Most importantly, it plays very nicely with the different tools’ ecosystems and lets us query data using SQL.
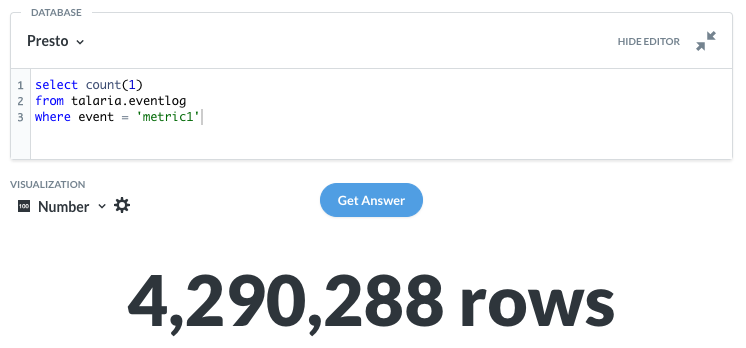
The figure below shows how often a particular event happened within the last hour. The query scans through almost 4 million rows and executes in about 1 second.
Design Goals
TalariaDB attempts to solve a specific business problem by unifying cold and hot storage data models. This reduces overall latency, and lets us build a set of simple services that queries and processes data. TalariaDB does not attempt to be a general-purpose database. Simplicity was a primary design goal. We also set the following functional and non-functional requirements.
Functional Requirements
-
Time-Series Metrics. The system can store thousands of different time-series metrics.
-
Data Retention. Keep the most recent data. This is configurable so we can extend the retention period on the fly.
-
Query or Aggregate by any dimension. We will build very complex queries using the full power of SQL and the Presto query engine for graphing, log retrieval, Grab Splainer, analytics, and other use-cases.
Non-functional Requirements
-
Linear, Horizontal Scalability. The hot data layer can scale to a multi-terabyte or even multi-petabyte scale.
-
Low Latency. The system responds and retrieves data for a particular combination of metric name and time window. The query executes within a few seconds at most, even if there is a petabyte of data.
-
Simplicity. The system is simple, easy to write, understand, and maintain.
-
Availability. The system is an Available & Partition tolerant system (AP in CAP terms), always responding to queries even when some nodes are unavailable. For our purposes, partial data is better than no data.
-
Zero Operation. The system “just works”, with zero manual intervention. It needs to scale for the years to come.
-
High Write Throughput. Since both read and write throughput are high, we support at least one million events per second on a cluster.
-
Cost. Given the scale, the system should be as low cost as possible. Ideally, it should be as cheap as the SSDs and still be able to query terabytes or even petabytes of data with predictable, low latency.
Where TalariaDB Sits in Our Data Pipeline
The figure below shows where TalariaDB fits in our event ingestion data pipeline’s architecture.
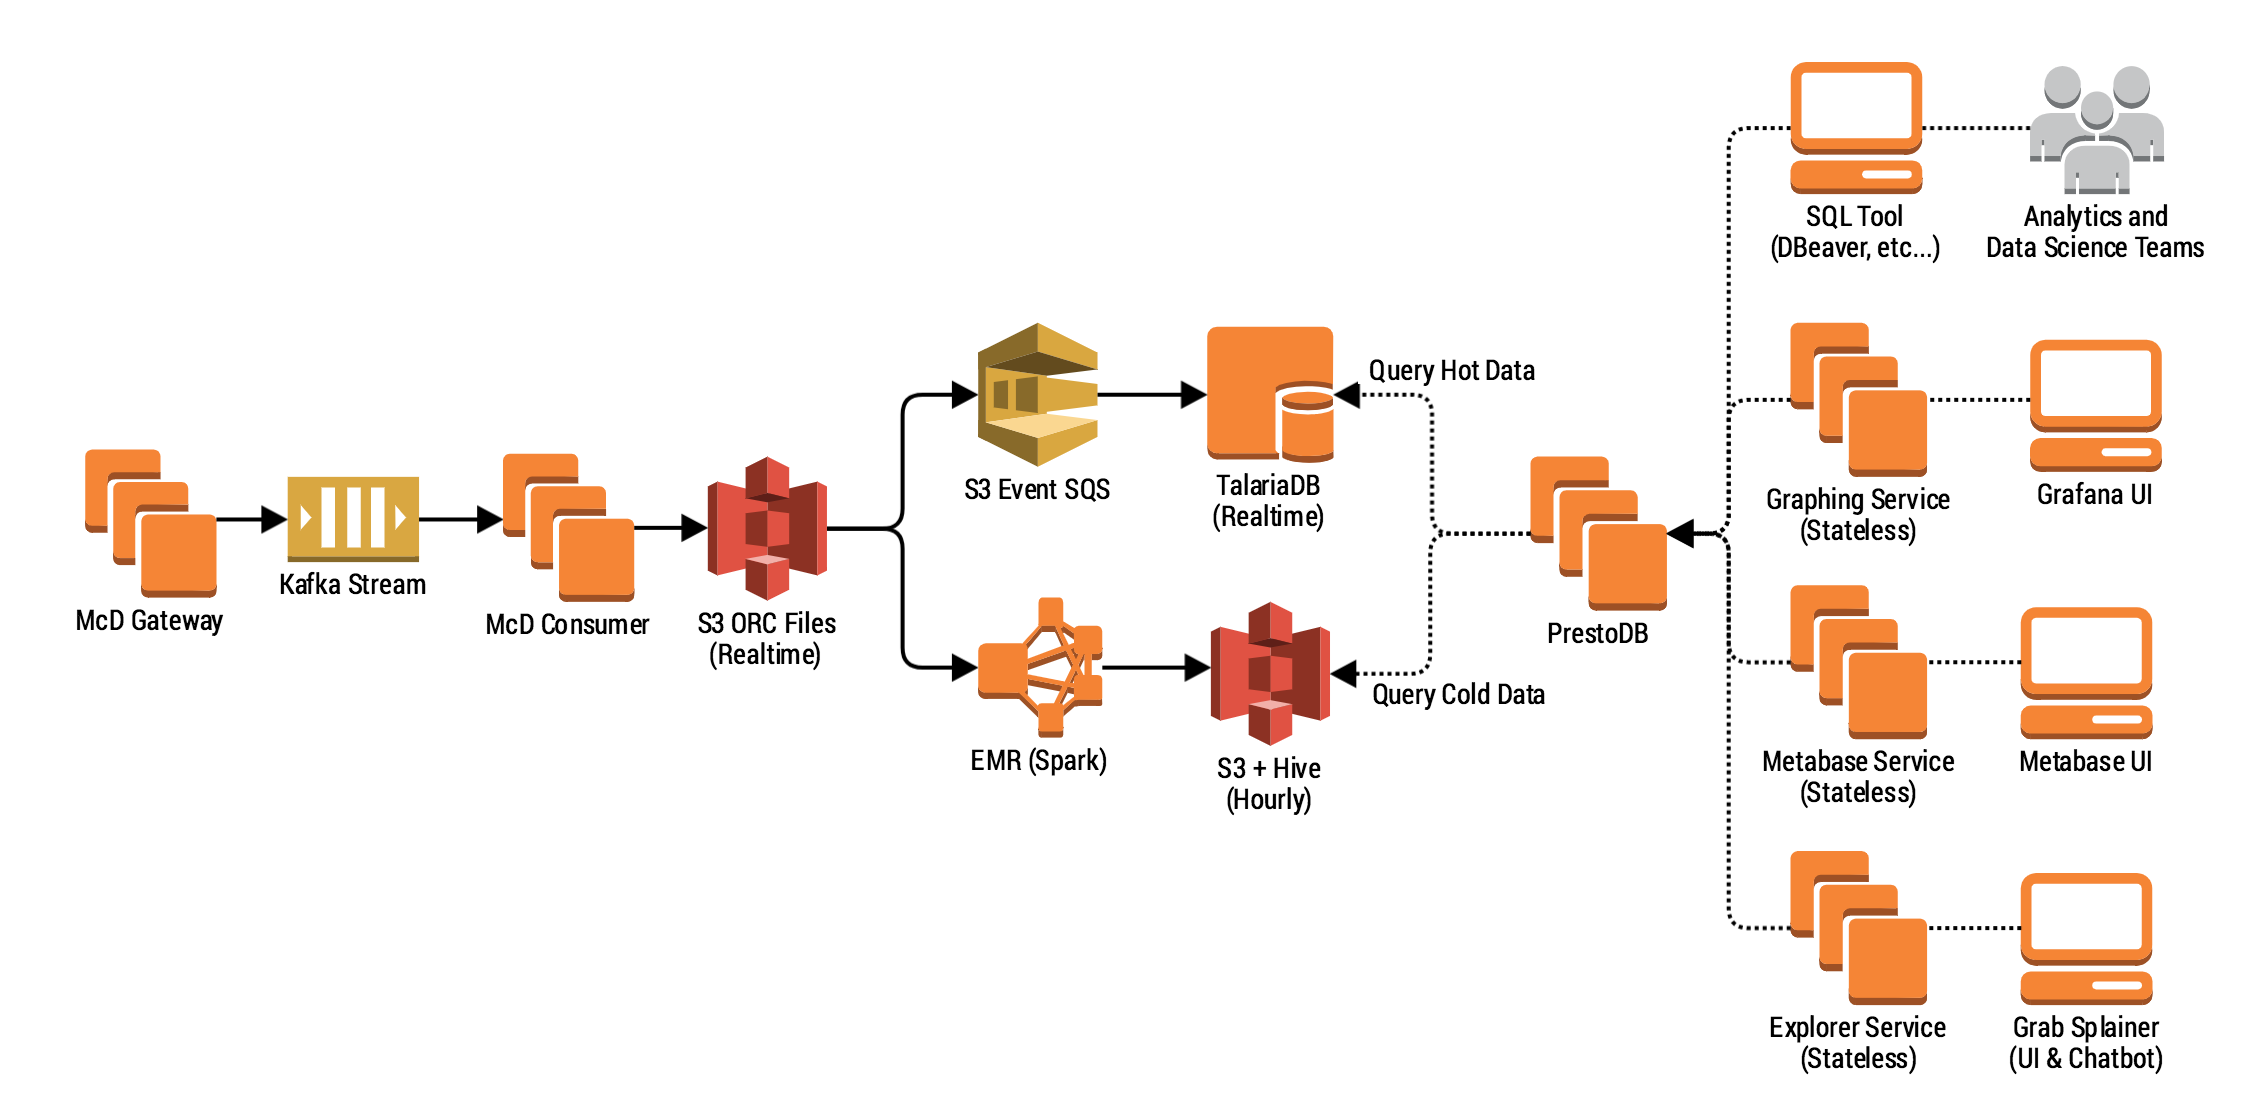
To help you understand this schema, let’s walk through what happens to a single event published from mobile app or a backend service.
xsdk.Track(ctx, "myEvent", 42, sdk.NewFacets().
    Passenger(123).
    Booking("ADR-123-2-001").
    City(10)
First, using the Track() function in our Golang, Android or iOS SDKs, an engineer tracks a metric as follows:
-
The tracked event goes into our McD Gateway service. It performs authentication if necessary, along with some basic enrichment (e.g. adding a unique event identifier). It then writes these events into our Kafka topic.
-
The McD Consumer service reads from Kafka and prepares a columnar ORC file which is then partitioned by event name. In the example above, myEvent is pushed into its own file together with all the other myEvents which are ingested at more or less the same time. This happens in real time and is written to an S3 bucket every 30 seconds.
-
A Spark hourly job kicks in every hour to create massive columnar files used for cold/warm storage retrieval.
-
The Presto query engine has both schemas registered letting users (people or systems) to perform sub-second queries on the data, and even combine the two schemas together by having a unified SQL layer.
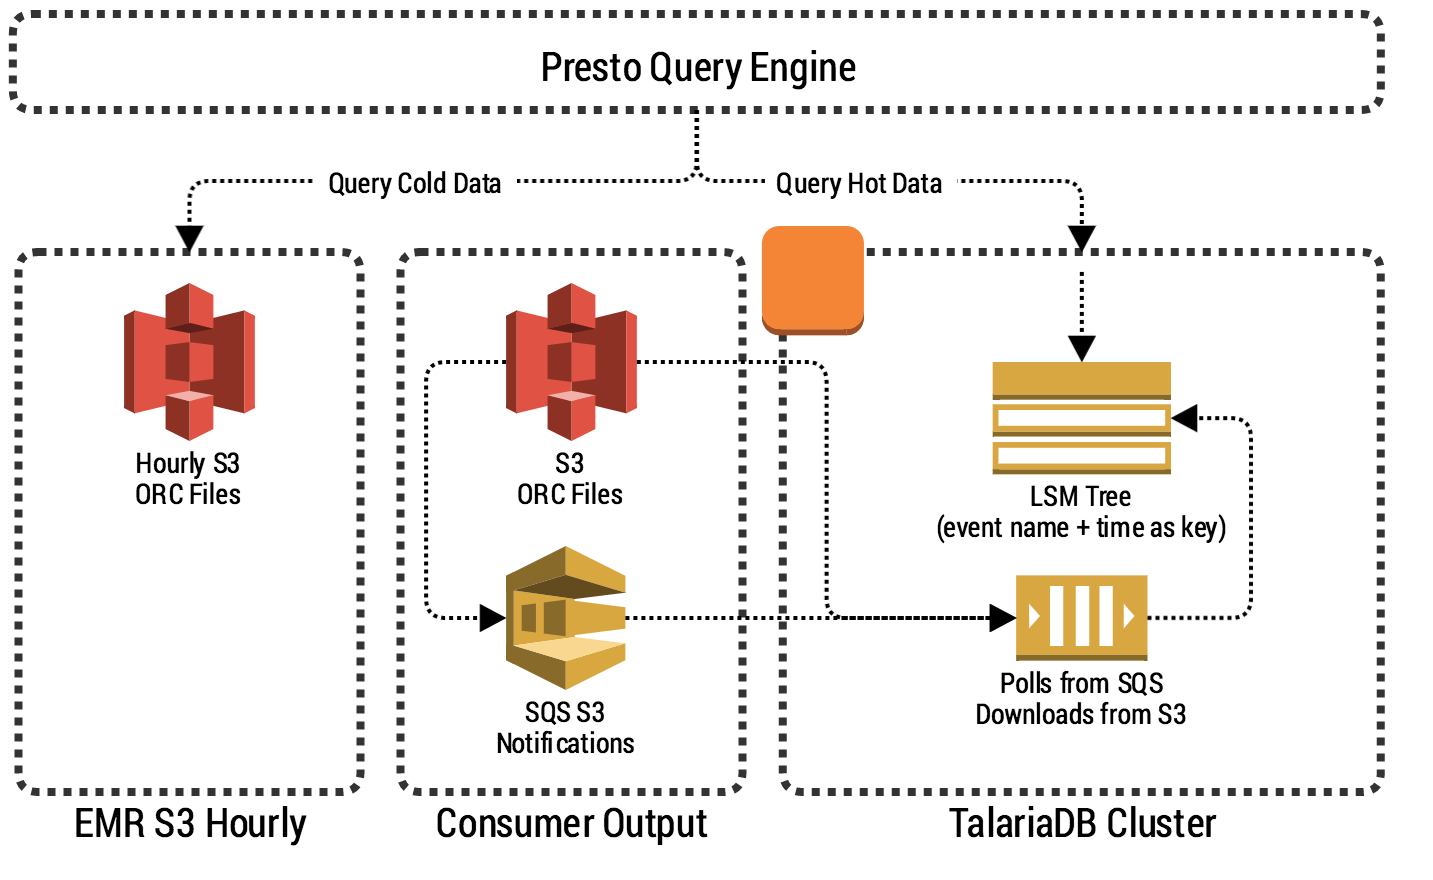
How TalariaDB is Designed
Now, let’s look at TalariaDB and its main components.

One of TalariaDB’s goals is simplicity. The system itself is not responsible for data transformation and data re-partitioning but only ingests and serves data to Presto.
To make sure TalariaDB scales to millions of events per second, it needs to leverage batching. A single event in TalariaDB is not stored as a single row. Instead, we store a pre-partitioned batch of events in a binary, columnar format. Spark streaming takes care of partitioning by event name (metric name) before writing to S3, making our design more streamlined and efficient.
You can see from the schema above, that the system really does only a few things:
-
Listens to SQS S3 notifications of Put Object, downloading each file and writing it to an internal LSM Tree with expiration.
-
Performs periodic compaction and garbage collection to evict expired data. This is essentially done by the underlying LSM Tree.
-
Exposes an API for Presto by implementing PrestoThriftConnector.
We experimented with several different storage backends, and Badger key-value store ended up winning our hearts. It’s an efficient and persistent log structured merge (LSM) tree based key-value store, purely written in Go. It is based upon the WiscKey paper from USENIX FAST 2016. This design is highly SSD-optimised and separates keys from values to minimise I/O amplification. It leverages both the sequential and the random performance of SSDs.
TalariaDB specifically leverages two of Badger’s unique features:
-
Very fast key iteration and seek. This lets us store millions of keys and quickly figure out which ones need to be retrieved.
-
Separation of keys and values. We keep the full key space in memory for fast seeks. But iteration and our values are memory-mapped for faster retrieval.
Columnar Time-series Database
As mentioned, a single event in TalariaDB is not stored as a single row, but as a pre-partitioned batch of events in binary, columnar format. This achieves fast ingestion and fast retrieval. As data will be aligned on disk, only that column needs to be selected and sent to Presto. The illustration in the next section shows the difference. That being said, it is inefficient to store large amounts of data in a single column. For fast iteration, TalariaDB stores millions of individual columnar values (smaller batches) and exposes a combined “index” of metric name and time.
The query pattern we serve is key to understand why we do this. We need to answer questions such as:
-
How many of a given event types are in a time window?
-
What is an aggregate for a given metric captured on a specific event (e.g. count, average)?
-
What are all the events for a passenger / driver-partner / merchant?
These use cases can be served with various trickery using a row based storage, but they require fairly complex and non-standard access patterns. We want to support anyone with an SQL client and SQL basic knowledge.
Data Layout & Query
TalariaDB combines a log-structured merge tree (LSMT) and columnar values to provide fast iteration and retrieval of an individual event type within a given time window. The keys are lexicographically ordered. When a query comes, TalariaDB essentially seeks to the first key for that metric and stops iterating when either it finds the next metric or reaches the time bound. The diagram below shows how the query is processed.
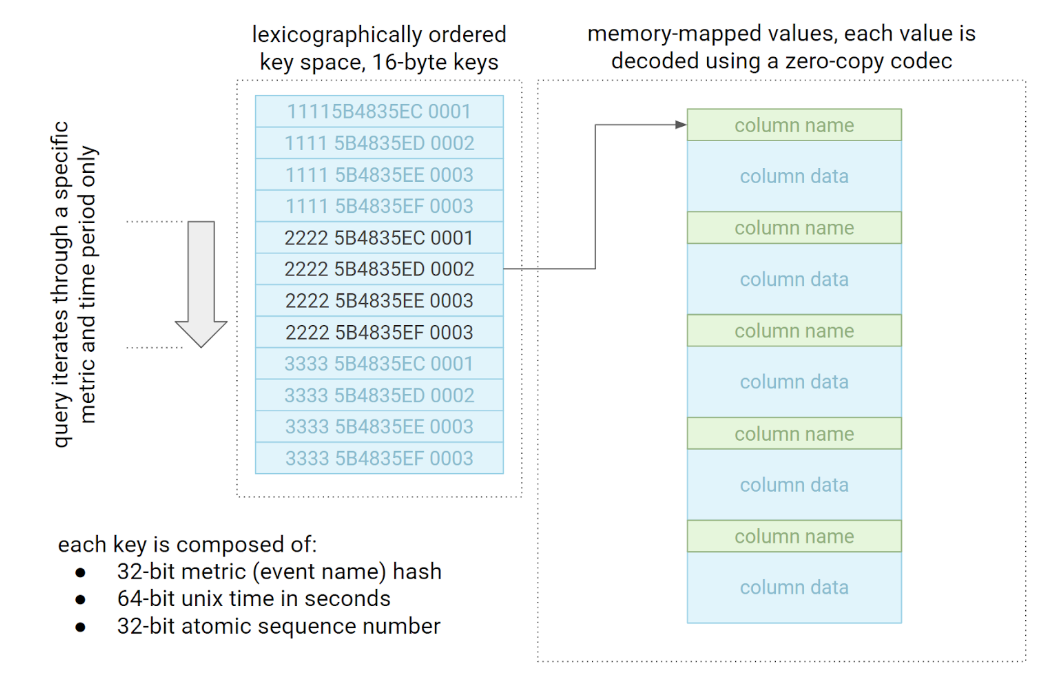
During the implementation, we had to reduce memory allocations and memory copies on read, which led us to implementing a zero-copy decoder. In other words, when a memory-mapped value is decoded, no data is copied around and we simply send it to PrestoDB as quickly and efficiently as possible.
Integrating with Presto
TalariaDB is queryable using the Presto query engine (or a thrift client implementing the Presto protocol) so we can keep things simple. To integrate TalariaDB and Presto, we leveraged the Presto Thrift Connector. To use the Thrift connector with an external system, you need to implement the PrestoThriftService interface. Next, configure the Thrift Connector to point to a set of machines, called Thrift servers, that implement the interface. As part of the interface implementation, the Thrift servers provide metadata, splits, and data. The Thrift server instances are assumed to be stateless and independent from each other.
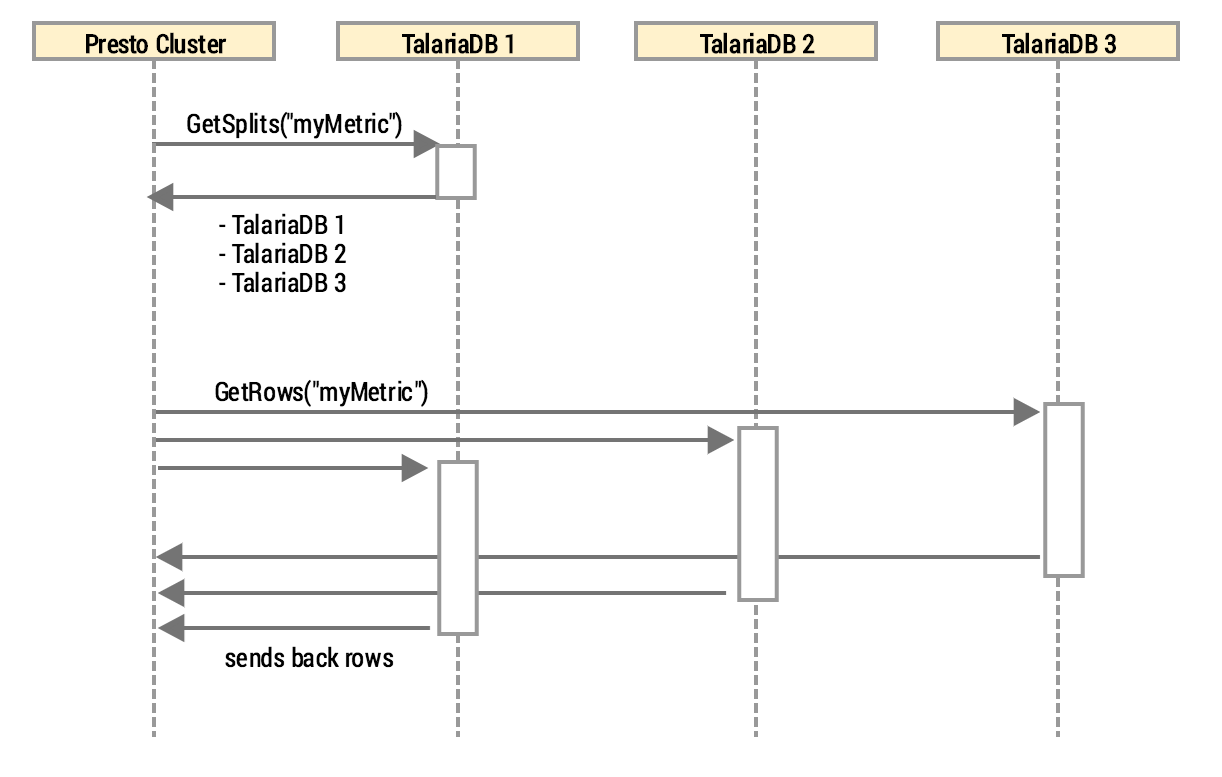
What Presto essentially does is query one of the TalariaDB nodes and requests “data splits”. TalariaDB replies with a list of machines containing the query’s data. In fact, it simply maintains a membership list of all of the nodes (using the reliable Gossip protocol) and returns to Presto a list of all the machines in the cluster. We solve the bootstrapping problem by simply registering the full membership list at a random period in Route53.
Next, Presto hits every TalariaDB instance in parallel for data retrieval. Interestingly enough, by adding a new machine in the TalariaDB cluster we gain data capacity and reduce query latency at the same time. This is provided the Presto cluster has an equal or larger amount of executors to process the data.
Scale and Elasticity
While scaling databases is not a trivial task, by sacrificing some of the requirements (such as strong consistency as per CAP), TalariaDB can scale horizontally by simply adding more hardware servers.
TalariaDB is not only highly available but also tolerant to network partitions. If a node goes down, data residing on the node becomes unavailable but new data will still be ingested and presented. We would much rather serve our consumers some data than no data at all. Going forward, we plan to transition the entire system to a Kubernetes StatefulSet integration. This lets us auto-heal the TalariaDB cluster without data loss, as Kubernetes manages the data volumes.
We do upscaling by adding a new machine to the cluster. It automatically joins the cluster by starting gossiping with one of the nodes (discovery is done using a DNS record, Route53 in our case). Once the instance joins the cluster, it starts polling from a queue the files it has to ingest.
Downscaling must be graceful, given we currently don’t replicate data. However, we can exploit that TalariaDB only stores data for the trailing time period. A graceful downscaling might be implemented by simply stopping ingesting new data but still serving data until everything the node holds is expired and storage is cleared. This is similar to how EMR deals with downscaling.
Conclusion
We have been running TalariaDB in production for a few months. Together with some major improvements in our data pipeline, we have built a global real-time feed from our mobile applications for our analysts, data scientists, and mobile engineers by helping them monitor and analyse behaviour and diagnose issues.
We achieved our initial goal of fast SQL queries while ingesting several terabytes of data per hour on our cluster. A query of a single metric typically takes a few seconds, even when returning several million rows. Moreover, we’ve also achieved one minute of end-to-end latency: when we track an event on the mobile app, it can be retrieved from TalariaDB within one minute of its happening.