
Machine-learning predictive autoscaling for Flink
Introduction
As Grab transitions to derive more valuable insights from our wealth of operational data, we are witnessing a steep increase in stream-processing applications. Over the past year, the number of Flink applications grew 2.5 times, driven by interest in real-time stream processing and the improved accessibility of developing such applications with Flink SQL. At this scale, it has become crucial for the internal Flink platform team to provide a cost-effective and self-service offering that supports users of diverse backgrounds.
Background: Flink at Grab
Flink at Grab is deployed in application mode, each pipeline has its own isolated resources for JobManager and TaskManager. Flink pipeline creators control both application logic and deployment configuration that affect throughput and performance, including OSS configurations:
- Number of TaskManagers and task slots per TaskManager
- CPU cores per TaskManager
- Memory per TaskManager
As pipeline creation has become more accessible, users of different backgrounds (analyst, data scientist, engineers, etc.) often struggle to choose a set of configurations that work for their applications. Many go through a long process of trial and error and still end up over-provisioning their applications, leading to huge resource waste. Moreover, pipeline behavior changes over time due to changes in application logic or data pattern, invalidating previous efforts in tuning and causing users to repeat the exercise.
In this article, we focus on addressing the challenge of efficient CPU provisioning for TaskManagers, as CPU constraints are a common bottleneck in our clusters. Our solution specifically targets Flink applications sourcing data from our message bus system (eg. Kafka, Change Data Capture Streams, DynamoDB Streams) , which represents the majority of our use cases. These workloads offer significant opportunities for cost savings due to their clear seasonal patterns, making them an ideal starting point for optimising autoscaling strategies.
Limits of reactive autoscaling
Our initial reactive setup
Our first automated solution relied on Flink’s Adaptive Scheduler in Reactive Mode. In this mode, each Flink application is deployed as its own individual Flink cluster running a dedicated job. The cluster greedily uses all available TaskManagers and scales its job parallelism accordingly. Running on Kubernetes, the cluster relies on Horizon Pod Autoscaler (HPA) to scale the number of TaskManager pods based on metrics such as CPU usage or custom metrics such as the pipeline’s consumer latency. While this solution was helpful initially, we quickly observed multiple issues with it. It is important to note that while the below issues can be solved by fine-tuning, it is a tedious trial and error effort that only works for specific applications, requiring users to repeat the process for every pipeline they own.
Restart spike: root cause of many issues
When autoscaling a Flink pipeline, the job restarts from the last checkpoint. This triggers an immediate spike in load, as the pipeline must reprocess records from the period between the last checkpoint and job restart, along with any new records that were backlogged at the source during the downtime. As a result, CPU usage and P99 consumer latency typically spikes after scaling events, for example, at 00:05 and 00:55, as shown in Figure 1. These spikes occur even though there is no change in source topic throughput. In this case, CPU usage surges from 0.5 cores to near provision limit of 2.5 cores, while consumer latency temporarily spiked from sub-second levels to as high as three minutes.

Reactive spiral and fluctuation
Typically, HPA scales on metrics such as CPU usage, consumer latency, or backpressure crossing a defined threshold. The challenge arises if these thresholds are misconfigured. The HPA’s reactive nature, when combined with restart spikes, can become detrimental to your Flink application. It piles additional load onto a system that’s already degrading, further amplifying the problem.

Figure 2 provides us a case study of reactive spiral and fluctuation, assuming we are having a pipeline that consumes a Kafka topic of 300 partitions:
- 07:00: As the source topic throughput increases, the P99 consumer latency rises due to insufficient processing power.
- 07:15: Reactive scaling is triggered, resulting in a scale out event. This is reflected in the increased TaskManager and task slot count. The pipeline continues to operate, as there is no increase in restart count.
- 07:30: As the P99 consumer latency remains high, reactive scaling continues to scale out incrementally. The records in rate by task rises rapidly as the pipeline reprocesses data from the checkpoint. During this period, the pipeline repeatedly restarts CPU usage drops significantly, and P99 consumer latency spikes to nearly one hour. This marks the onset of a spiral failure.
- 08:00: Reactive scaling reaches its upper limit of 300 slots, corresponding to the number of partitions in the source topic. This halts the spiral effect as it cannot scale out any further. Without disruption from autoscaling restart, the pipeline begins to process the backlog since the last successful checkpoint, as observed by the significant increase in records in rate by task. As the pipeline catches up, it eventually stabilizes, and the P99 consumer latency returns to normal levels.
- 08:30 - 10:15: The P99 consumer latency returns to normal levels, below the threshold. Reactive scaling triggers scale-in events despite the source topic throughput continuing to trend upward. During these scale-in events, P99 latency fluctuates, occasionally spiking up to 15 minutes. However, these fluctuations are not severe enough to prevent the repeated scale in process.
- 10:15: The P99 consumer latency rises again, triggering a scale-out event back to the upper limit of 300 slots.
- 11:15-11:45: Despite the source topic throughput maintaining an upward trend, the pipeline undergoes multiple scale-in events in quick succession, encounters latency issues due to reprocessing data from checkpoints, and scales out again shortly after. This is an example of fluctuation after scaling in, resulting in 6 restarts within a 30 minutes window.
Limited parallelism constraints
Even with HPA, we frequently encounter a bottleneck when trying to scale our applications’ throughput. This is primarily because some of our connectors, most notably the Kafka connector, don’t inherently support dynamic parallelism changes. Kafka topics, by design, have a fixed number of partitions. This directly limits the number of parallel consumers we can run. Consequently, once we reach this maximum parallelism for our consumers, we often have to scale up resources, for example, increase memory/CPU per instance instead of scaling out (adding more instances).
Predictive Resource Advisor
Assumptions and hypothesis
To tackle the issue of reactive spirals and fluctuations, the new solution should have the following characteristics:
- Vertical scaling: To tackle the issue of limited parallelism with our dependencies, we should be looking at vertical instead of horizontal scaling.
- Predictive: Adjust CPU to scale up or down before demand spikes or dips occur, ensuring the system is prepared for changes in workload. This prevents artificial workload increases caused by processing backlogs on top of actual workload increase, further straining the system.
- Deterministic: The CPU configuration must be precisely calculated based on the workload demand, ensuring predictable and consistent resource allocation. For a given workload, the calculated CPU value should remain the same every time, eliminating variability and uncertainty in scaling decisions.
- Accurate: Determine the optimal CPU configuration required to handle workload demand in a single, precise calculation, avoiding the inefficiencies of multi-step, trial-and-error tuning.
Key observations
Our solution is conceptualized based on key observations of our Flink applications:
- The CPU usage of Flink applications is primarily driven by the input load.
- The input load of our Flink applications can be accurately forecasted using time-series forecasting techniques.
- Time-based autoscaling that relies solely on historical CPU usage is not robust enough to adapt to evolving workloads. This approach also carries the risk of a negative self-amplifying feedback loop: each autoscaling restart causes a CPU usage spike (as illustrated in Figure 1), which, if anomalies are not properly handled, inflates subsequent CPU calculations.
Model formulation
We then formulate the relationship between CPU usage and input load using a regression model to provide a mathematical framework for predicting CPU requirements based on workload patterns, expressed as:
Ct = f(xt)
In this equation:
- Ct represents the CPU required at a specific point in time.
- xt represents the input workload at the corresponding point in time.
- f() represents the regression function that maps the input load to the required CPU capacity.
Input load, represented by Kafka source topic throughput in our case, is chosen as the independent variable xt because it reflects true business demand and is entirely independent of Flink consumers. This metric is influenced solely by the business logic of upstream producers and remains unaffected by any changes or behaviors in the Flink consumer pipeline.
Proposed solution
Our predictive autoscaler operates through four key stages as shown in Figure 3.

Stage 1: Workload forecast model
The workload forecast model is a time-series forecasting model trained on actual workload data, specifically source topic throughput from our Kafka cluster (1). This approach is particularly effective as our workload exhibits seasonal patterns. While historical data could be directly used as input for CPU prediction, time-series forecasting offers a more robust solution by enabling the model to account for organic traffic growth over time. Through periodic retraining, the model adapts to evolving workload trends, ensuring more accurate and reliable predictions for resource provisioning.
Stage 2: Resource prediction model
This follows the regression-based model Ct = f(xt) defined earlier. We use the same source topic throughput from our Kafka cluster (2a) as input feature xt, and the Flink application’s Kubernetes CPU usage metric (2b) as output label Ct for model training. To ensure clean and representative data for model training, we collect CPU usage metrics under conditions that simulate infinite resource availability. We include data exclusively from periods of continuous and stable operation, as determined by latency, uptime, and restart metrics (2b), eliminating biases caused by hardware limitations or disruptions.
Stage 3: Workload forecasting
To prepare for autoscaling, we forecast the workload for the future t-hour window (3) using our trained time-series forecast model.
Stage 4: Predict CPU usage
The forecasted workload (3) is fed into the resource prediction model to estimate the CPU usage required to handle that workload. The predicted value is then refined using custom safety feature adjustments to account for variability and ensure stability. This adjusted prediction is passed to the custom autoscaler controller, which evaluates the current CPU configuration of the TaskManager deployment. If the adjusted predicted value differs from the existing CPU configuration, the controller initiates vertical scaling to update the TaskManager deployment accordingly.
Proof of concept and results
Experiment setup
To validate our hypothesis, we present a deep dive into one of our experiments. This pipeline features complex business logic, aggregates from multiple Kafka sources, with a checkpoint interval of one minute and a maximum consumer latency of five minutes.
We set up an experimental pipeline with configurations identical to the production pipeline (the control). Both applications sourced data from the same Kafka topics but sank data to alternative topics to maintain isolation. The Predictive Resource Advisor was enabled on the experimental pipeline, while the control pipeline operated with fixed CPU provisioning.
Results
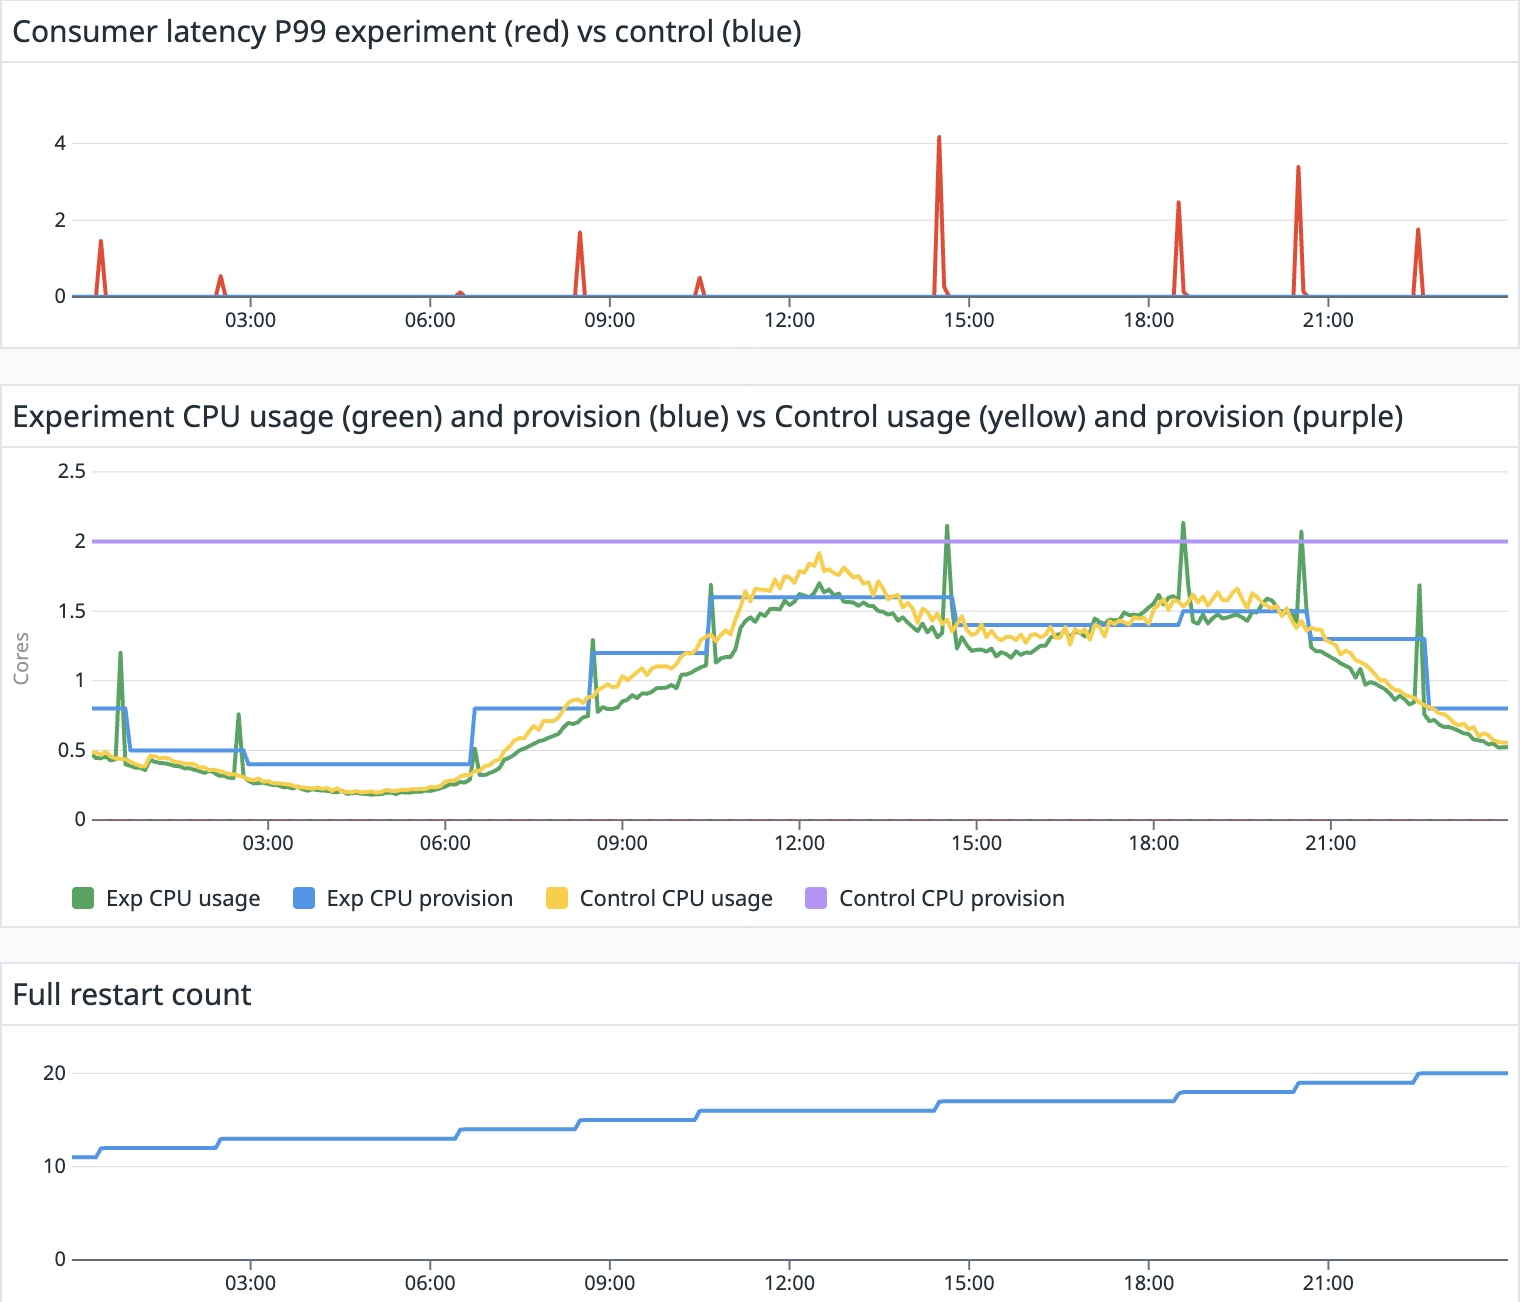
Figure 4 demonstrates a strong correlation between CPU usage (yellow, green) and the total Kafka topics throughput. The variable CPU provisioning (blue) for the experimental pipeline is calculated by our autoscaler models, which were trained exclusively on data collected from the experiment pipeline. The CPU usage trend of the experimental pipeline closely mirrors that of the control pipeline and remains aligned with the Kafka throughput trend. However, the experimental pipeline’s CPU provisioning is dynamically adjusted to more closely match its actual CPU usage, whereas the control pipeline maintains a static CPU allocation (purple). This illustrates the model’s effectiveness in dynamically adjusting CPU allocation to meet variable workload demands.

Without autoscaler enabled, the control pipeline experienced no disruptions and maintained latency (blue) consistently below one second, which is not visible in Figure 5. On the other hand, the experiment pipeline latency (red) experienced a highest recorded peak latency of just over four minutes during a single disruption window. Other latency spikes observed were comparable to or lower than the three minutes peak latency previously identified as part of the restart spike issue analysis. The varied durations and amplitudes of these spikes showed some correlation with the heavy Kafka topic throughput during those periods. Importantly, there were only nine autoscaling events throughout the day, resulting in nine restarts for the experiment pipeline.
Outcome
The Predictive Resource Advisor solution has been successfully deployed across more than 50% of applicable production applications, specifically those consuming from Kafka topics and exhibiting seasonal workload patterns with some tolerance for disruptions. This implementation has delivered significant results across three key areas, stability, efficiency, and user experience.
Stability
With autoscaling becoming more predictable and controllable, our Flink applications experience fewer disruptions caused by autoscaling fluctuations. The machine learning and predictive capabilities of the solution also ensure that applications remain operational during periods of increased workload by automatically learning and adapting to organic growth trends and workload surges.
Efficiency
Applications powered by the Predictive Resource Advisor demonstrated significant improvements in CPU provisioning, aligning CPU configuration more closely with actual requirements, particularly during low traffic periods. As a result of this optimization, on average, these applications made approximately >35% savings in cloud infrastructure cost.
User experience
The solution has simplified the deployment process for users, allowing them to simply deploy Flink applications with default configurations. The Predictive Resource Advisor automatically collects data, trains autoscaling models, and applies configuration changes, thus eliminating the need for manual fine-tuning. This significantly enhances the user experience by streamlining pipeline maintenance and enabling self-service capabilities, such as effortless onboarding. It empowers users to explore and derive value from real-time features with minimal effort.
What’s next?
Our journey doesn’t stop here. We’re continuously working to enhance our predictive autoscaler, with the following key areas of focus:
- Tackling memory configuration (Predictive Resource Advisor’s next frontier)
Memory is critical yet often misconfigured that can lead to unrecoverable failures for example, OOMKilled. Our next major goal for the Predictive Resource Advisor is to take on memory tuning, completely removing the burden of complex memory configuration from our users and further empowering them. - Enhancing model accuracy
To further improve the robustness of our predictions, we are actively exploring advanced techniques in input feature engineering and anomaly detection, especially for workloads exhibiting frequent bursting patterns. By refining these aspects, we aim to extend the applicability of our solution to a broader range of Flink applications, including those connected to diverse sources such as change data capture systems or batch-like, spiky workloads, such as the Flink applications powering our real-time data lake. - Streamlining model training
We’re developing a more efficient model training workflow. A particularly exciting avenue we’re investigating is the use of pretrained time-series forecasting models based on large language model architectures.
References
- Flink deployed in Application Mode
- Flink Elastic Scaling in Reactive Mode
- Three steps is all you need: fast, accurate, automatic scaling decisions for distributed streaming dataflows
Join us
Grab is a leading superapp in Southeast Asia, operating across the deliveries, mobility and digital financial services sectors. Serving over 800 cities in eight Southeast Asian countries, Grab enables millions of people everyday to order food or groceries, send packages, hail a ride or taxi, pay for online purchases or access services such as lending and insurance, all through a single app. Grab was founded in 2012 with the mission to drive Southeast Asia forward by creating economic empowerment for everyone. Grab strives to serve a triple bottom line – we aim to simultaneously deliver financial performance for our shareholders and have a positive social impact, which includes economic empowerment for millions of people in the region, while mitigating our environmental footprint.
Powered by technology and driven by heart, our mission is to drive Southeast Asia forward by creating economic empowerment for everyone. If this mission speaks to you, join our team today!