 Engineering
Profile-guided optimisation (PGO) on Grab services
Profile-guided optimisation (PGO) is a technique where CPU profile data for an application is collected and fed back into the next compiler build of Go application. The compiler then uses this CPU profile data to optimise the performance of that build by around 2-14% currently (future releases could likely improve this figure further).
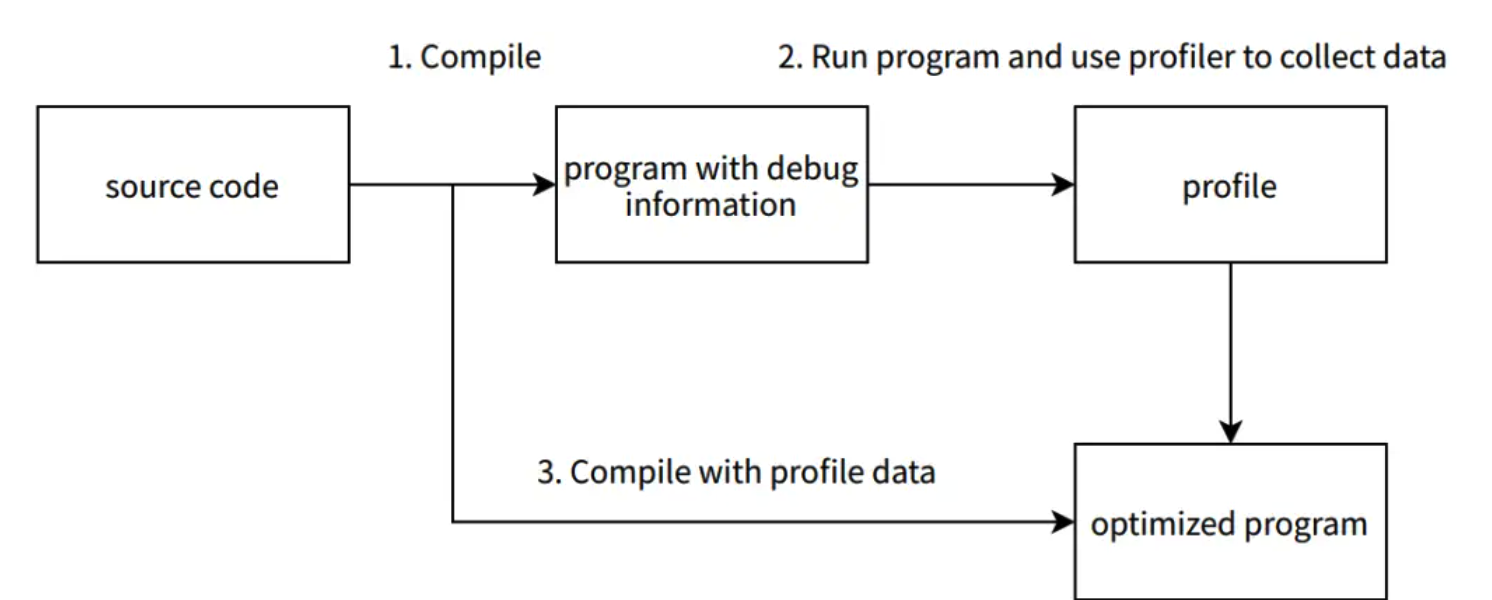
PGO is a widely used technique that can be implemented with many programming languages. When it was released in May 2023, PGO was introduced as a preview in Go 1.20.
Enabling PGO on a service
Profile the service to get pprof file
First, make sure that your service is built using Golang version v1.20 or higher, as only these versions support PGO.
Next, enable pprof in your service.
If it’s already enabled, you can use the following command to capture a 6-minute profile and save it to /tmp/pprof.
curl 'http://localhost:6060/debug/pprof/profile?seconds=360' -o /tmp/pprof
Enabled PGO on the service
TalariaDB: TalariaDB is a distributed, highly available, and low latency time-series database for Presto open sourced by Grab.
It is a service that runs on an EKS cluster and is entirely managed by our team, we will use it as an example here.
Since the cluster deployment relies on a Docker image, we only need to update the Docker image’s go build command to include -PGO=./talaria.PGO. The talaria.PGO file is a pprof profile collected from production services over a span of 360 seconds.
If you’re utilising a go plugin, as we do in TalariaDB, it’s crucial to ensure that the PGO is also applied to the plugin.
Here’s our Dockerfile, with the additions to support PGO.
FROM arm64v8/golang:1.21 AS builder

ARG GO111MODULE="on"
ARG GOOS="linux"
ARG GOARCH="arm64"
ENV GO111MODULE=${GO111MODULE}
ENV GOOS=${GOOS}
ENV GOARCH=${GOARCH}

RUN mkdir -p /go/src/talaria
COPY . src/talaria
#RUN cd src/talaria && go mod download  && go build && test -x talaria
RUN cd src/talaria && go mod download  && go build -PGO=./talaria.PGO && test -x talaria

RUN mkdir -p /go/src/talaria-plugin
COPY ./talaria-plugin  src/talaria-plugin
RUN cd src/talaria-plugin && make plugin && test -f talaria-plugin.so
FROM arm64v8/debian:latest AS base

RUN apt-get update && apt-get install -y ca-certificates && rm -rf /var/cache/apk/*

WORKDIR /root/
ARG GO_BINARY=talaria
COPY  --from=builder /go/src/talaria/${GO_BINARY} .
COPY  --from=builder /go/src/talaria-plugin/talaria-plugin.so .

ADD entrypoint.sh .
RUN mkdir /etc/talaria/ && chmod +x /root/${GO_BINARY} /root/entrypoint.sh
ENV TALARIA_RC=/etc/talaria/talaria.rc
EXPOSE 8027
ENTRYPOINT ["/root/entrypoint.sh"]
Result on enabling PGO on one GrabX service
It’s important to mention that the pprof utilised for PGO was not captured during peak hours and was limited to a duration of 360 seconds.
Service TalariaDB has three clusters and the time we enabled PGO for these clusters are:
- We enabled PGO on cluster 0, and deployed on 4 Sep 11.16 AM.
- We enabled PGO on cluster 1, and deployed on 5 Sep 15:00 PM.
- We enabled PGO on cluster 2, and deployed on 6 Sep 16:00 PM.
The size of the instances, their quantity, and all other dependencies remained unchanged.
CPU metrics on cluster
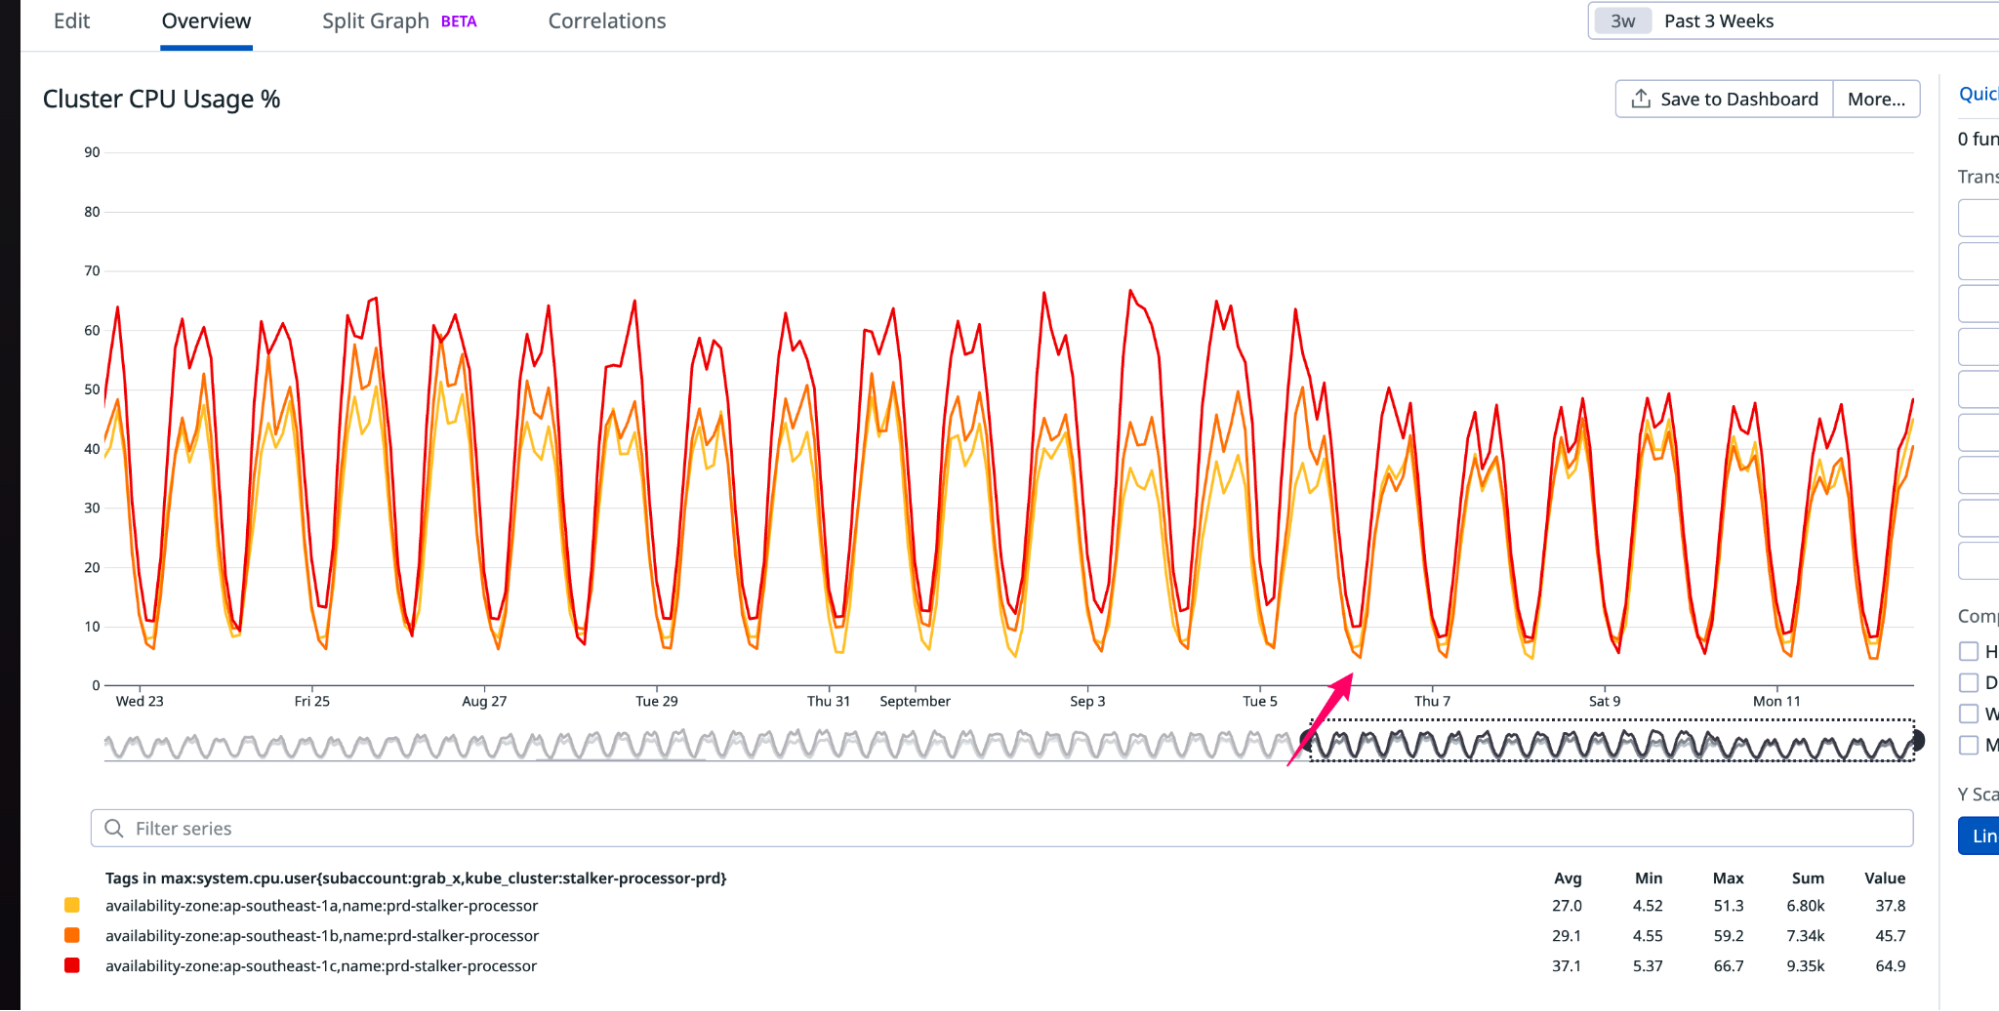
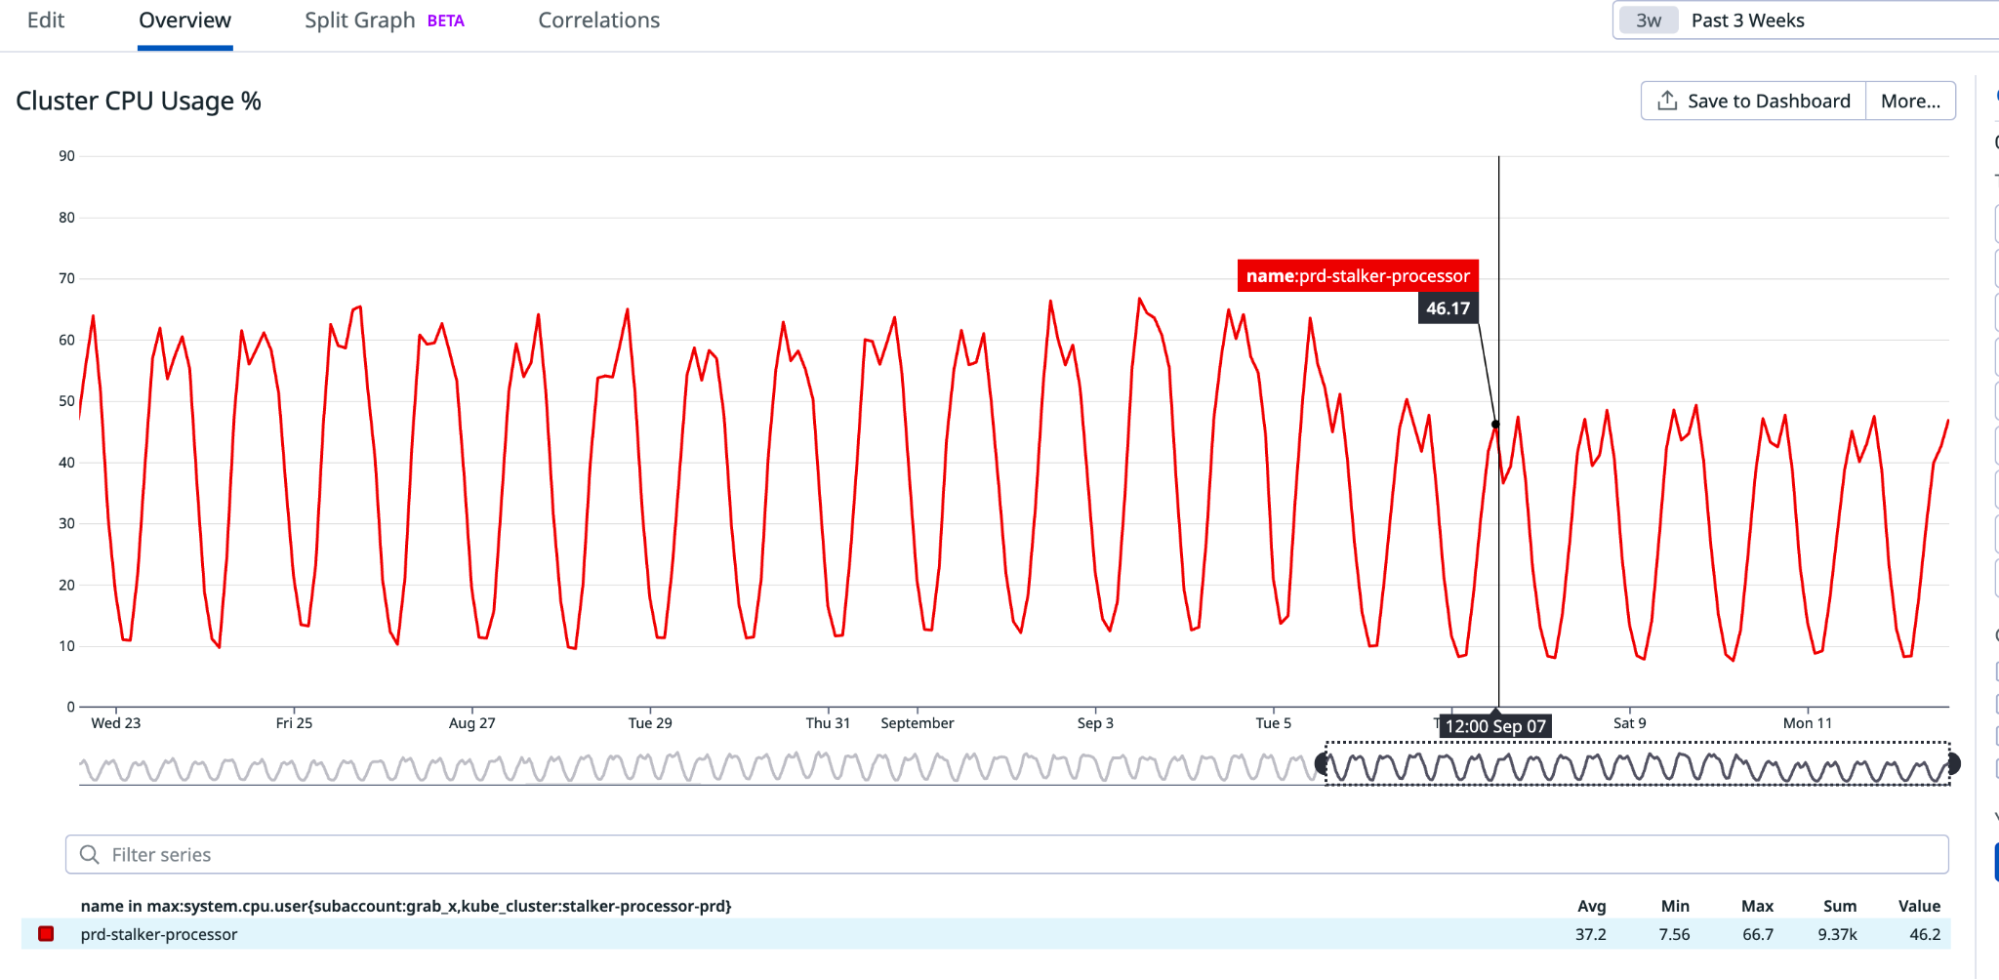
It’s evident that enabling PGO resulted in at least a 10% reduction in CPU usage.
Memory metrics on cluster
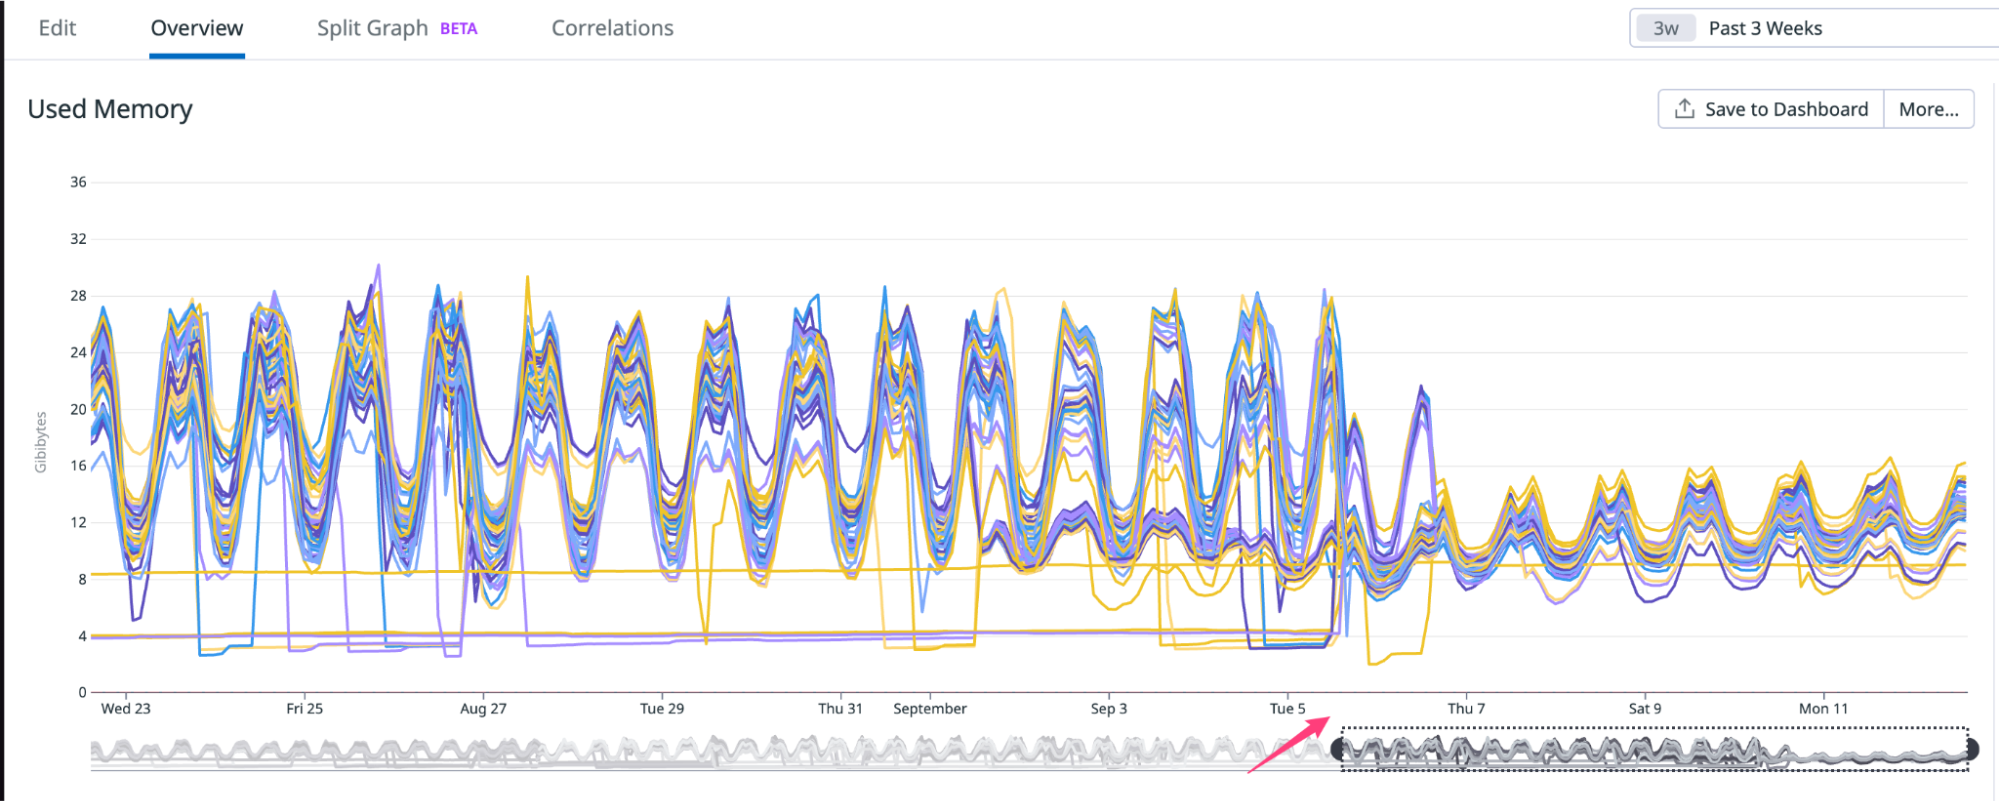
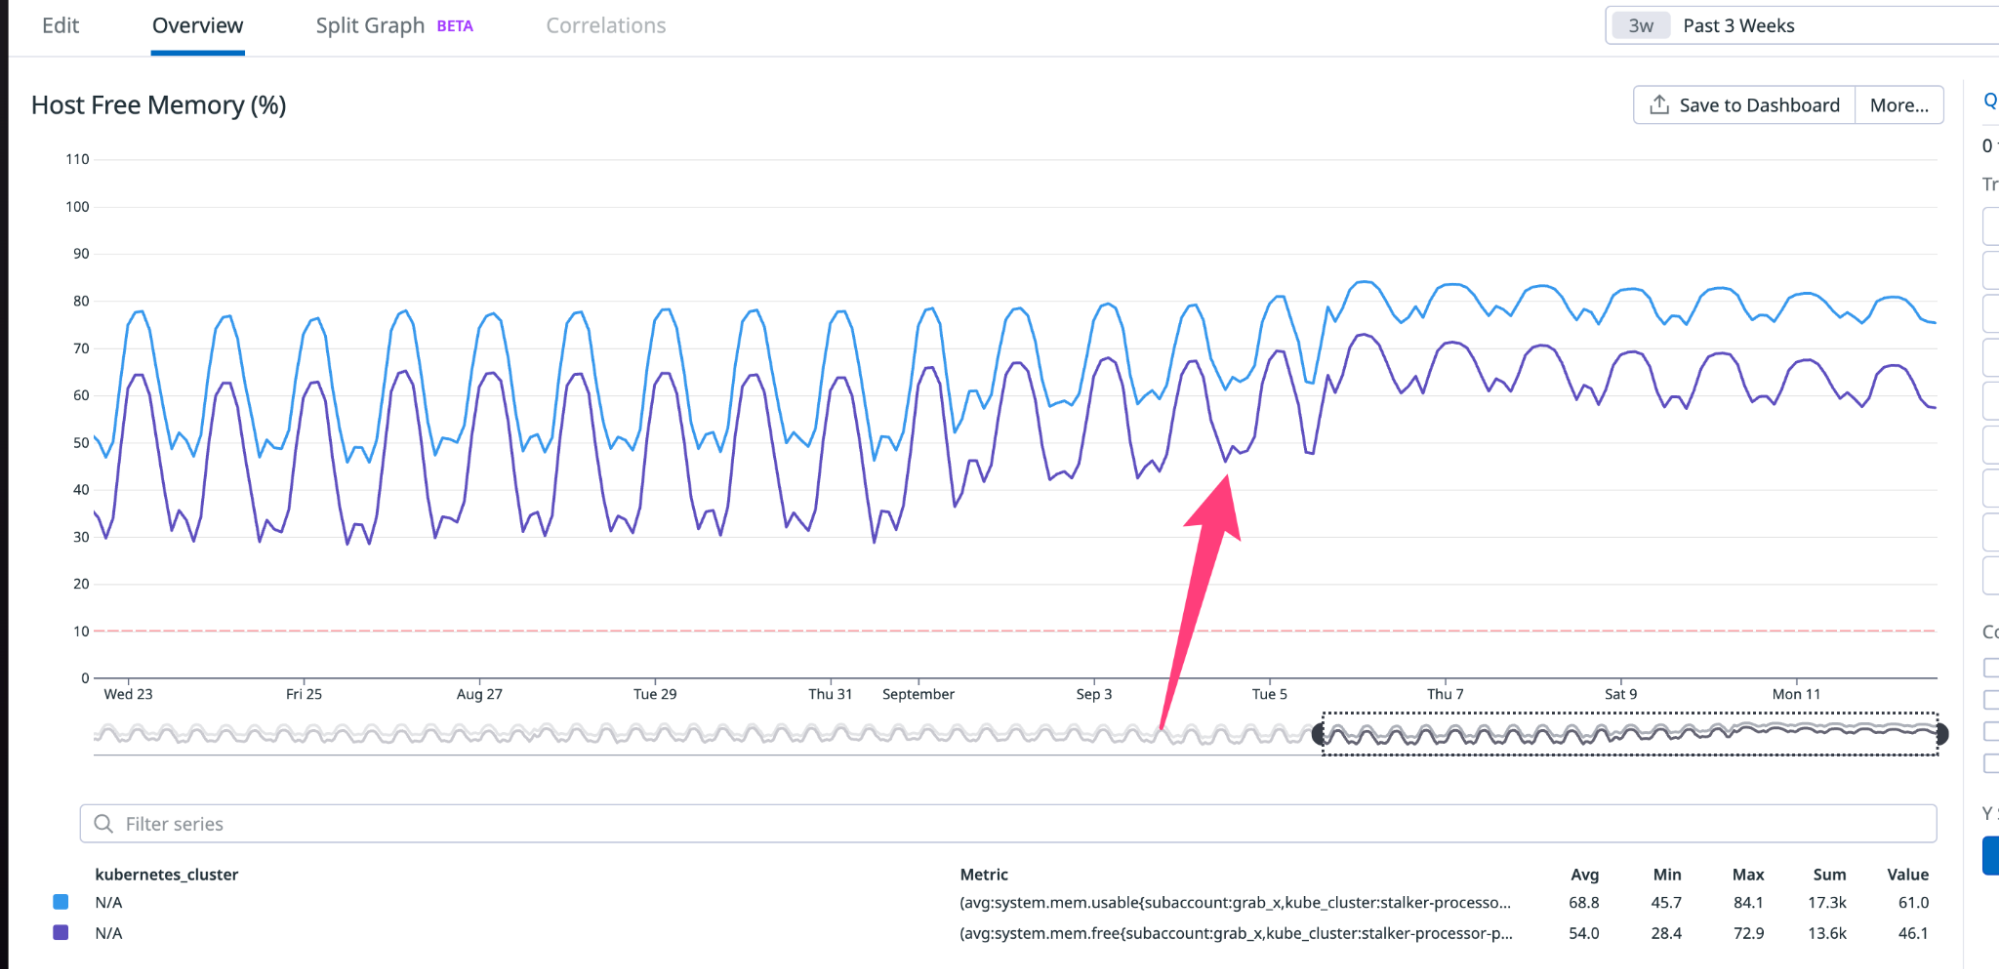
It’s clear that enabling PGO led to a reduction of at least 10GB (30%) in memory usage.
Volume metrics on cluster
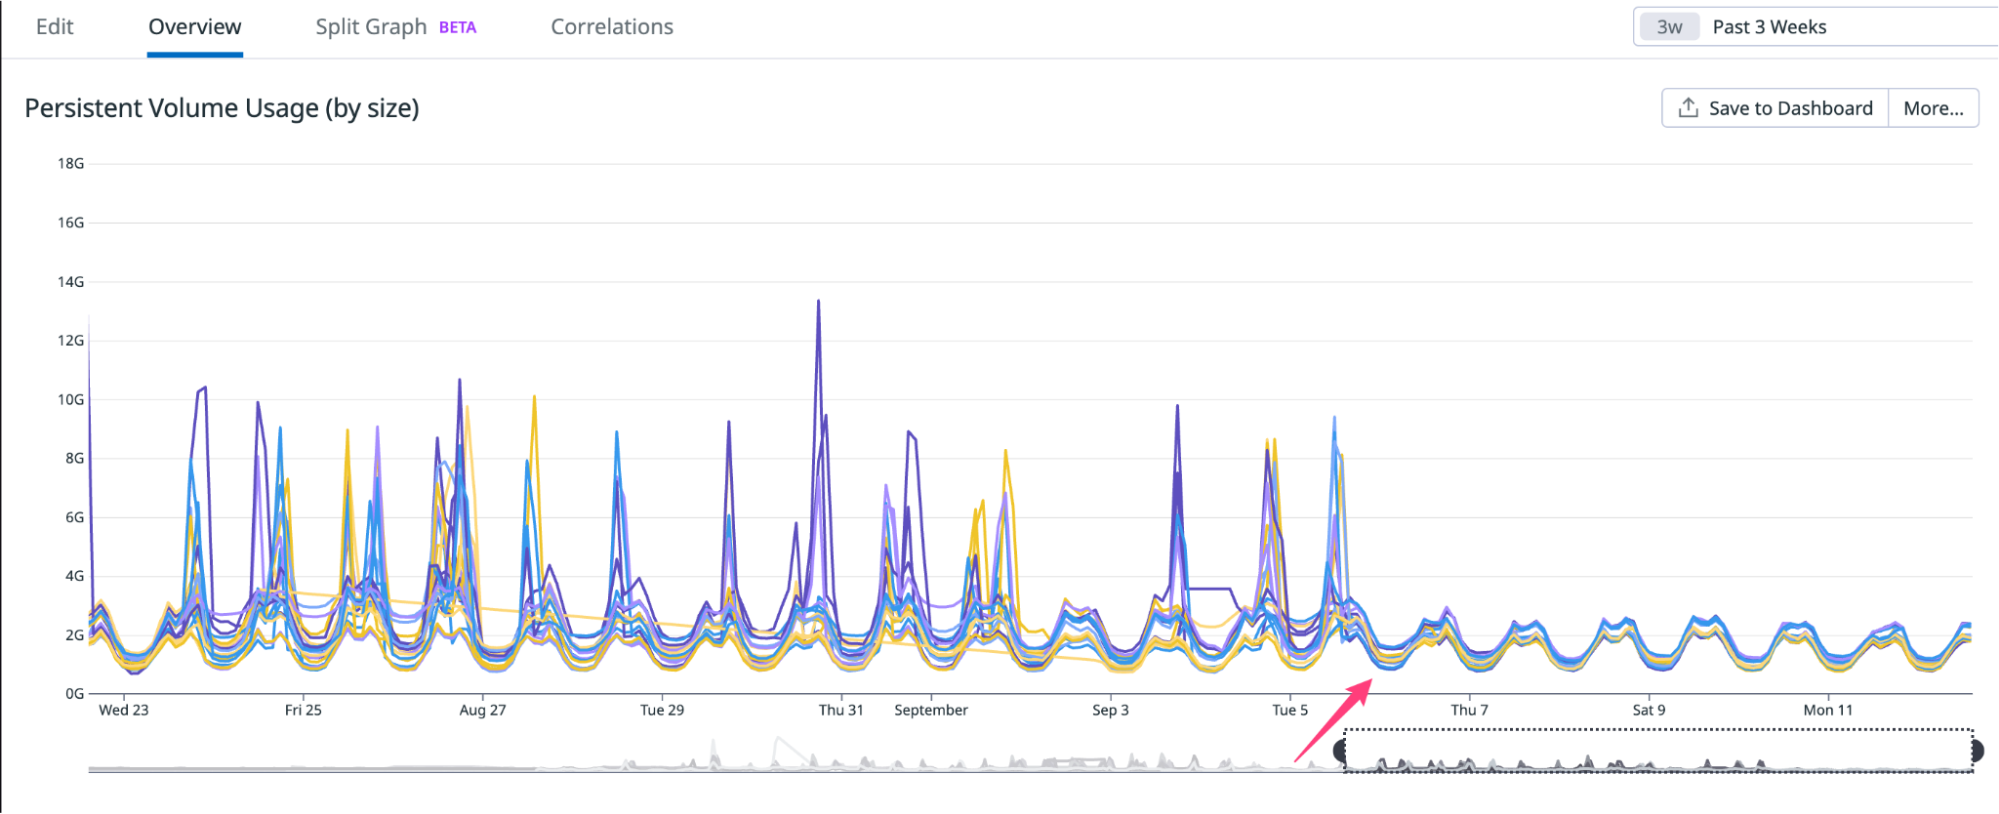

Enabling PGO resulted in a reduction of at least 7GB (38%) in volume usage. This volume is utilised for storing events that are queued for ingestion.
Ingested event count/CPU metrics on cluster
To gauge the enhancements, I employed the metric of ingested event count per CPU unit (event count / CPU). This approach was adopted to account for the variable influx of events, which complicates direct observation of performance gains.
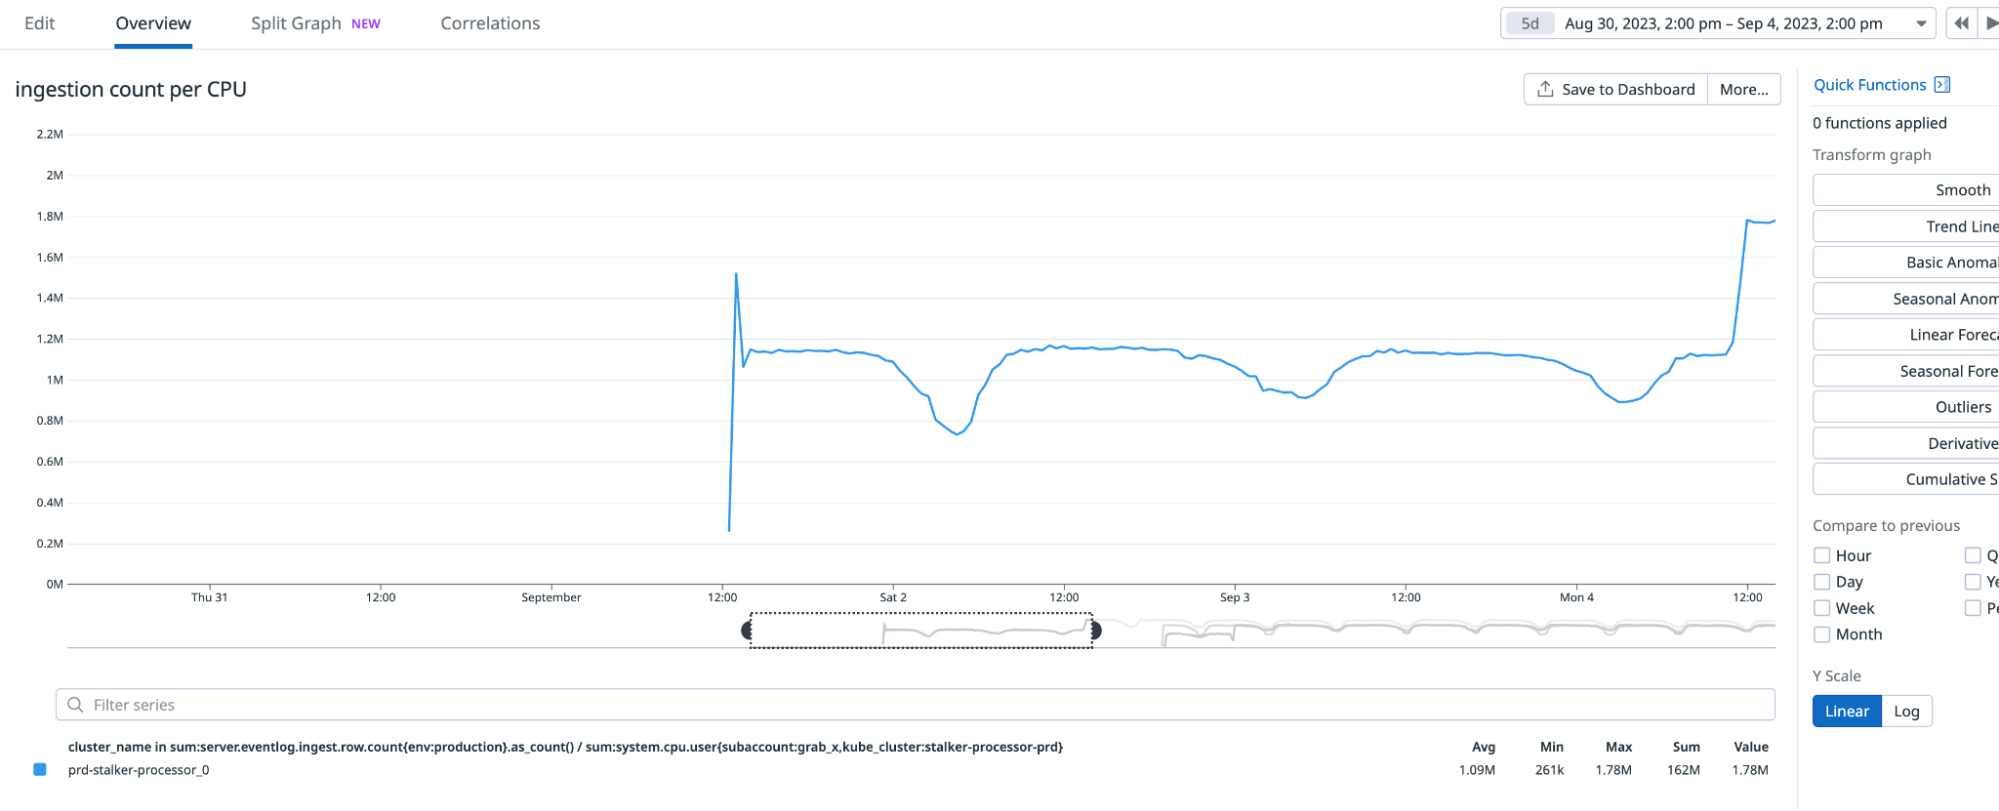
Upon activating PGO, there was a noticeable increase in the ingested event count per CPU, rising from 1.1 million to 1.7 million, as depicted by the blue line in the cluster screenshot.
How we enabled PGO on a Catwalk service
We also experimented with enabling PGO on certain orchestrators in a Catwalk service. This section covers our findings.
Enabling PGO on the test-golang-orch-tfs orchestrator
Attempt 1: Take pprof for 59 seconds
- Just 1 pod running with a constant throughput of 420 QPS.
- Load test started with a non-PGO image at 5:39 PM SGT.
- Take pprof for 59 seconds.
- Image with PGO enabled deployed at 5:49 PM SGT.
Observation: CPU usage increased after enabling PGO with pprof for 59 seconds.
We suspected that taking pprof for just 59 seconds may not be sufficient to collect accurate metrics. Hence, we extended the duration to 6 minutes in our second attempt.
Attempt 2 : Take pprof for 6 minutes
- Just 1 pod running with a constant throughput of 420 QPS.
- Deployed non PGO image with custom pprof server at 6:13 PM SGT.
- pprof taken at 6:19 PM SGT for 6 minutes.
- Image with PGO enabled deployed at 6:29 PM SGT.
Observation: CPU usage decreased after enabling PGO with pprof for 6 minutes.
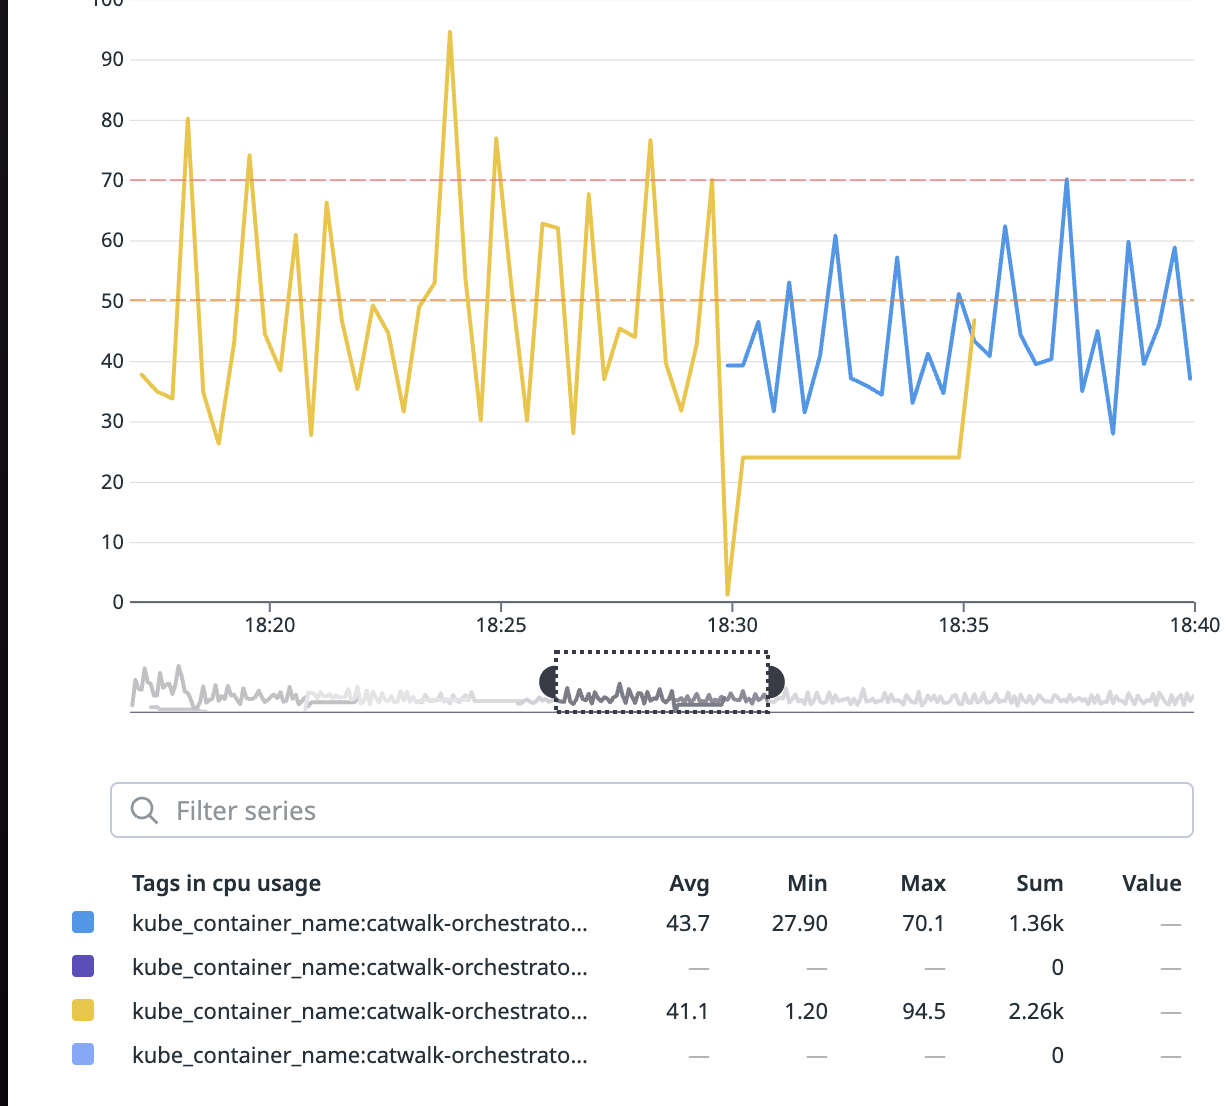
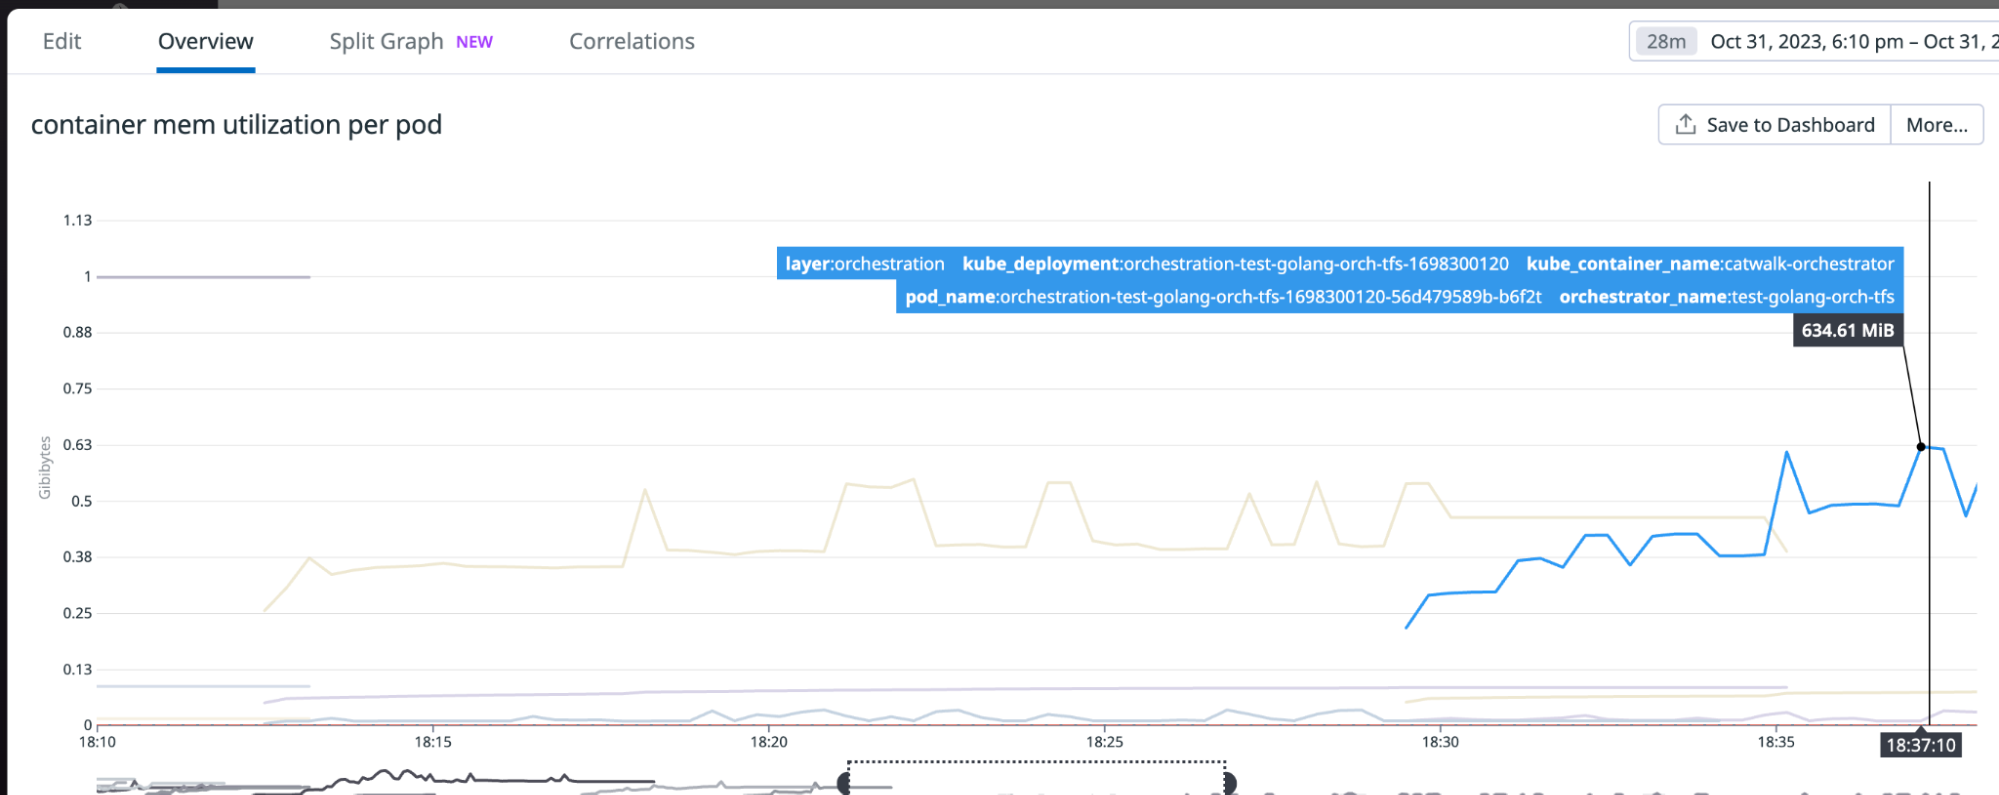
Based on this experiment, we found that the impact of PGO is around 5% but the effort involved to enable PGO outweighs the impact. To enable PGO on Catwalk, we would need to create Docker images for each application through CI pipelines.
Additionally, the Catwalk team would require a workaround to pass the pprof dump, which is not a straightforward task. Hence, we decided to put off the PGO application for Catwalk services.
Looking into PGO for monorepo services
From the information provided above, enabling PGO for a service requires the following support mechanisms:
- A pprof service, which is currently facilitated through Jenkins.
- A build process that supports PGO arguments and can attach or retrieve the pprof file.
For services that are hosted outside the monorepo and are self-managed, the effort required to experiment is minimal. However, for those within the monorepo, we will require support from the build process, which is currently unable to support this.
Conclusion/Learnings
Enabling PGO has proven to be highly beneficial for some of our services, particularly TalariaDB. By using PGO, we’ve observed a clear reduction in both CPU usage and memory usage to the tune of approximately 10% and 30% respectively. Furthermore, the volume used for storing queued ingestion events has been reduced by a significant 38%. These improvements definitely underline the benefits and potential of utilising PGO on services.
Interestingly, applying PGO resulted in an increased rate of ingested event count per CPU unit on TalariaDB, which demonstrates an improvement in the service’s efficiency.
Experiments with the Catwalk service have however shown that the effort involved to enable PGO might not always justify the improvements gained. In our case, a mere 5% improvement did not appear to be worth the work required to generate Docker images for each application via CI pipelines and create a solution to pass the pprof dump.
On the whole, it is evident that the applicability and benefits of enabling PGO can vary across different services. Factors such as application characteristics, current architecture, and available support mechanisms can influence when and where PGO optimisation is feasible and beneficial.
Moving forward, further improvements to go-build and the introduction of PGO support for monorepo services may drive greater adoption of PGO. In turn, this has the potential to deliver powerful system-wide gains that translate to faster response times, lower resource consumption, and improved user experiences. As always, the relevance and impact of adopting new technologies or techniques should be considered on a case-by-case basis against operational realities and strategic objectives.
Join us
Grab is the leading superapp platform in Southeast Asia, providing everyday services that matter to consumers. More than just a ride-hailing and food delivery app, Grab offers a wide range of on-demand services in the region, including mobility, food, package and grocery delivery services, mobile payments, and financial services across 428 cities in eight countries.
Powered by technology and driven by heart, our mission is to drive Southeast Asia forward by creating economic empowerment for everyone. If this mission speaks to you, join our team today!

