
Structured Logging: The Best Friend You’ll Want When Things Go Wrong
Introduction
Every day millions of people around Southeast Asia count on Grab to get themselves or what they need from point A to B in a safe, comfortable and reliable manner. In fact, just very recently we crossed our 3 billion transport rides milestone, gaining the last billion in just a mere 6 months!
We take this responsibility very seriously, and as we continue to grow and expand, it’s important for us to maintain a sophisticated backend system that is capable of sustaining the kind of scale needed to support all our consumers in Southeast Asia. This backend system is comprised of multiple services that interact with each other in many different ways. As Grab evolves, maintaining them becomes a significantly larger and harder task as developers continuously develop new features.
To maintain these systems well, it’s important to have better observability; data that helps us better understand what is happening in the system by having good monitoring (metrics), event logs, and tracing for request scope data. Out of these, logs provide the most complete picture of what happened within the system - and is typically the first and most engaged point of contact. With good logs, the backend becomes much easier to understand, maintain, and debug. Without logs or with bad logs - we have a recipe for disaster; making it nearly impossible to understand what’s happening.
In this article, we focus on a form of logging called structured logging. We discuss what it is, why is it better, and how we built a framework that integrates well with our current Elastic stack-based logging backend, allowing us to do logging better and more efficiently.
Structured Logging is a part of a larger endeavour which will enable us to reduce the Mean Time To Resolve (MTTR), helping developers to mitigate issues faster when outages happen.
What are Logs?
Logs are lines of texts containing some information about some event that occurred in our system, and they serve a crucial function of helping us understand what’s happening in the backend. Logs are usually placed at points in the code where a significant event has happened (for example, some database operation succeeded or a passenger got assigned to a driver) or at any other place in the code that we are interested in observing.
The first thing that a developer would normally do when an error is reported is check the logs - sort of like walking through the history of the system and finding out what happened. Therefore, logs can be a developer’s best friend in times of service outages, errors, and failed builds.
Logs in today’s world have varying formats and features.
- Log Format: These range from simple key-value based (like syslog) to quite structured and detailed (like JSON). Since logs are mostly meant for developer eyes, how detailed or structured a log is dictates how fast the developer can query the logs, as well as read them. The more structured the data is - the larger the size is per log line, although it’s more queryable and contains richer information.
- Levelled Logging (or Log Levels): Logs with different severities can be logged at different levels. The visibility can be limited to a single level, limiting all logs only with a certain severity or above (for example, only logs WARN and above). Usually log levels are static in production environments, and finding DEBUG logs usually requires redeploying.
- Log Aggregation Backend: Logs can have different log aggregation backends, which means different backends (i.e. Splunk, Kibana, etc.) decide what your logs might look like or what you might be able to do with them. Some might cost a lot more than others.
- Causal Ordering: Logs might or might not preserve the exact time in which they are written. This is important, as how exact the time is dictates how accurately we can predict the sequence of events via logs.
- Log Correlation: We serve countless requests from our backend services. Being able to see all the logs relevant to a particular request or a particular event helps us drill down to relevant information for a specific request (e.g. for a specific passenger trying to book a ride).
Combine this with the plethora of logging libraries available and you easily have a developer who is holding his head in confusion, unable to decide what to use. Also, each library has their own set of advantages and disadvantages, so the discussion might quickly become subjective and polarised - therefore it is crucial that you choose the appropriate library and backend pair for your applications.
We at Grab use different types of logging libraries. However, as requirements changed - we also found ourselves re-evaluating our logging strategy.
The State of Logging at Grab
The number of Golang services at Grab has continuously grown. Most services used syslog-style key-value format logs, recognised as the most common format of logs for server-side applications due to its simplicity and ease for reading and writing. All these logs were made possible by a handful of common libraries, which were directly imported and used by different services.
We used a cloud-based SaaS vendor as a frontend for these logs, where application-emitted logs were routed to files and sent to our logging vendor, making it possible to view and query them in real time. Things were pretty great and frictionless for a long time.
However, as time went by, our logging bills started mounting to unprecedented levels and we found ourselves revisiting and re-evaluating how we did logging. A few issues surfaced:
- Logging volume reduction efforts were successful to some extent - but were arduous and painful. Part of the reason was that almost all the logs were at a single log level - INFO.
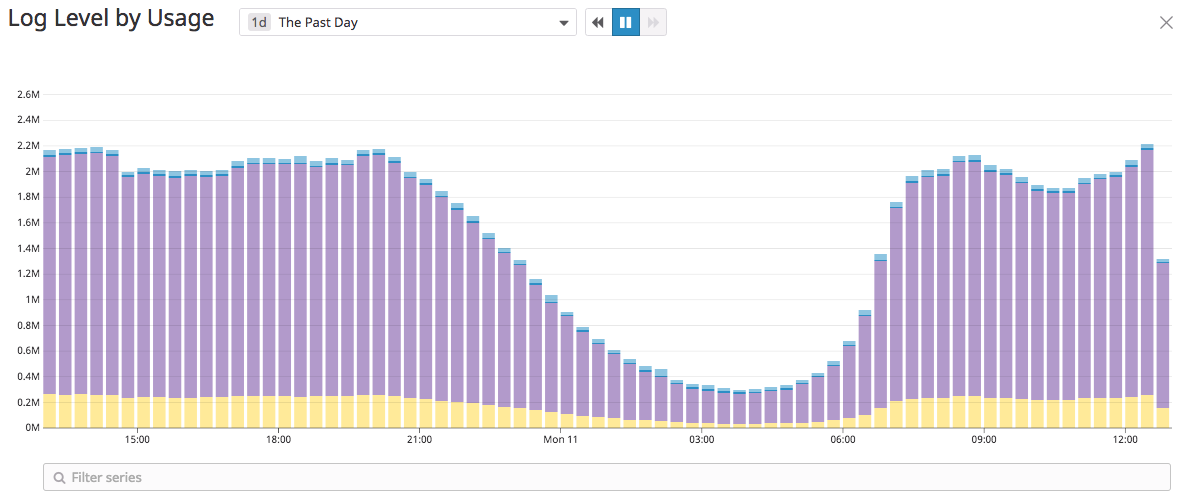 Figure 1: Log Level Usage
This issue was not limited to a single service, but pervasive across services. For mitigation, some services added sampling to logs, some removed logs altogether. The latter is only a recipe for disaster, so it was known that we had to improve levelled logging.
- The vendor was expensive for us at the time and also had a few concerns - primarily with limitations around DSL (query language). There were many good open source alternatives available - Elastic stack to name one. Our engineers felt confident that we could probably manage our logging infrastructure and manage the costs better - which led to the proposal and building of Elastic stack logging cluster. Elasticsearch is vastly more powerful and rich than our vendor at the time and our current libraries weren’t enough to fully leverage its capabilities, so we needed a library which can leverage structure in logs better and easily integrate with Elastic stack.
- There were some minor issues in our logging libraries namely:
- Singleton initialisation pattern that made unit-testing harder
- Single logger interface that reduced the possibility of extending the core logging functionality as almost all the services imported the logger interface directly
- No out-of-the-box support for multiple writers
-
If we were to write a library, we had to fix these issues - and also encourage usage of best practices.
- Grab’s critical path (number of services traversed by a single booking flow request) has grown in size. On average, a single booking request touches multiple microservices - each of which does something different. At the large scale at which we operate, it’s necessary therefore to easily view logs from all the services for a single request - however this was not something which was done automatically by the library. Hence, we also wanted to make log correlation easier and better.
- Logs are events which happened at some point of time. The order in which these events occurred gives us a complete history of what happened in the system. However, the core logging library which formed the base of the logging across our Golang services didn’t preserve the log generation time (it instead used write time). This led to jumbling of logs which are generated in a span of a few microseconds - which not only makes the lives of our developers harder, but makes it near impossible to get an exact history of the system. This is why we wanted to also improve and enable causal ordering of logs - one of the key steps in understanding what’s happening in the system.
Why Change?
As mentioned, we knew there were issues with how we were logging. To best approach the problem and be able to solve it as much as possible without affecting existing infrastructure and services, it was decided to bootstrap a new library from the ground up. This library would solve known issues, as well as contain features which would not have been possible by modifying existing libraries. For a recap, here’s what we wanted to solve:
- Improve levelled logging
- Leverage structure in logs better
- Easily integrate with Elastic stack
- Encourage usage of best practices
- Make log correlation easier and better
- Improve and enable causal ordering of logs for a better understanding of service distribution
Enter Structured Logging. Structured Logging has been quite popular around the world, finding widespread adoption. It was easily integrable with our Elastic stack backend and would also solve most of our pain points.
Structured Logging
Keeping our previous problems and requirements in mind, we bootstrapped a library in Golang, which has the following features:
Dynamic Log Levels
This allows us to change our initialised log levels at runtime from a configuration management system - something which was not possible and encouraged before.
This makes the log levels actually more meaningful now - developers can now deploy with the usual WARN or INFO log levels, and when things go wrong, just with a configuration change they can update the log level to DEBUG and make their services output more logs when debugging. This also helps us keep our logging costs in check. We made support for integrating this with our configuration management system easy and straightforward.
Consistent Structure in Logs
Logs are inherently unstructured unlike database schema, which is rigid, or a freeform text, which has no structure. Our Elastic stack backend is primarily based on indices (sort of like tables) with mapping (sort of like a loose schema). For this, we needed to output logs in JSON with a consistent structure (for example, we cannot output integer and string under the same JSON field because that will cause an indexing failure in Elasticsearch). Also, we were aware that one of our primary goals was keeping our logging costs in check, and since it didn’t make sense to structure and index almost every field - adding only the structure which is useful to us made sense.
For addressing this, we built a utility that allows us to add structure to our logs deterministically. This is built on top of a schema in which we can add key-value pairs with a specific key name and type, generate code based on that - and use the generated code to make sure that things are consistently formatted and don’t break. We called this schema (a collection of key name and type pairs) the Common Grab Log Schema (CGLS). We only add structure to CGLS which is important - everything included in CGLS gets formatted in the different field and everything else gets formatted in a single field in the generated JSON. This helps keeps our structure consistent and easily usable with Elastic stack.
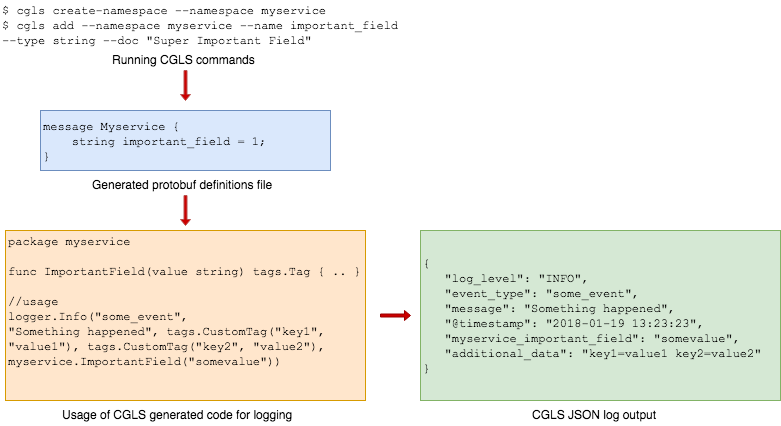 Figure 2: Overview of Common Grab Log Schema for Golang backend services
Plug and Play Support with Grab-Kit
We made the initialisation and use easy and out-of-the-box with our in-house support for Grab-Kit, so developers can just use it without making any drastic changes. Also, as part of this integration, we added automatic log correlation based on request IDs present in traces, which ensured that all the logs generated for a particular request already have that trace ID.
Configurable Log Format
Our primary requirement was building a logger expressive and consistent enough to integrate with the Elastic stack backend well - without going through fancy log parsing in the downstream. Therefore, the library is expressive and configurable enough to allow any log format (we can write different log formats for different future use cases. For example, readable format in development settings and JSON output in production settings), with a default option of JSON output. This ensures that we can produce log output which is compatible with Elastic stack, but still be configurable enough for different use cases.
Support for Multiple Writes with Different Formats
As part of extending the library’s functionality, we needed enough configurability to be able to send different logs to different places at different settings. For example, sending FATAL logs to Slack asynchronously in some readable format, while sending all the usual logs to our Elastic stack backend. This library includes support for chaining such “cores” to any arbitrary degree possible - making sure that this logger can be used in such highly specialised cases as well.
Production-like Logging Environment in Development
Developers have been seeing console logs since the dawn of time, however having structured JSON logs which are only meant for production logs and are more searchable provides more power. To leverage this power in development better and allow developers to directly see their logs in Kibana, we provide a dockerised version of Kibana which can be spun up locally to accept structured logs. This allows developers to directly use the structured logs and see their logs in Kibana - just like production!
Having this library enabled us to do logging in a much better way. The most noticeable impact was that our simple access logs can now be queried better - with more filters and conditions.
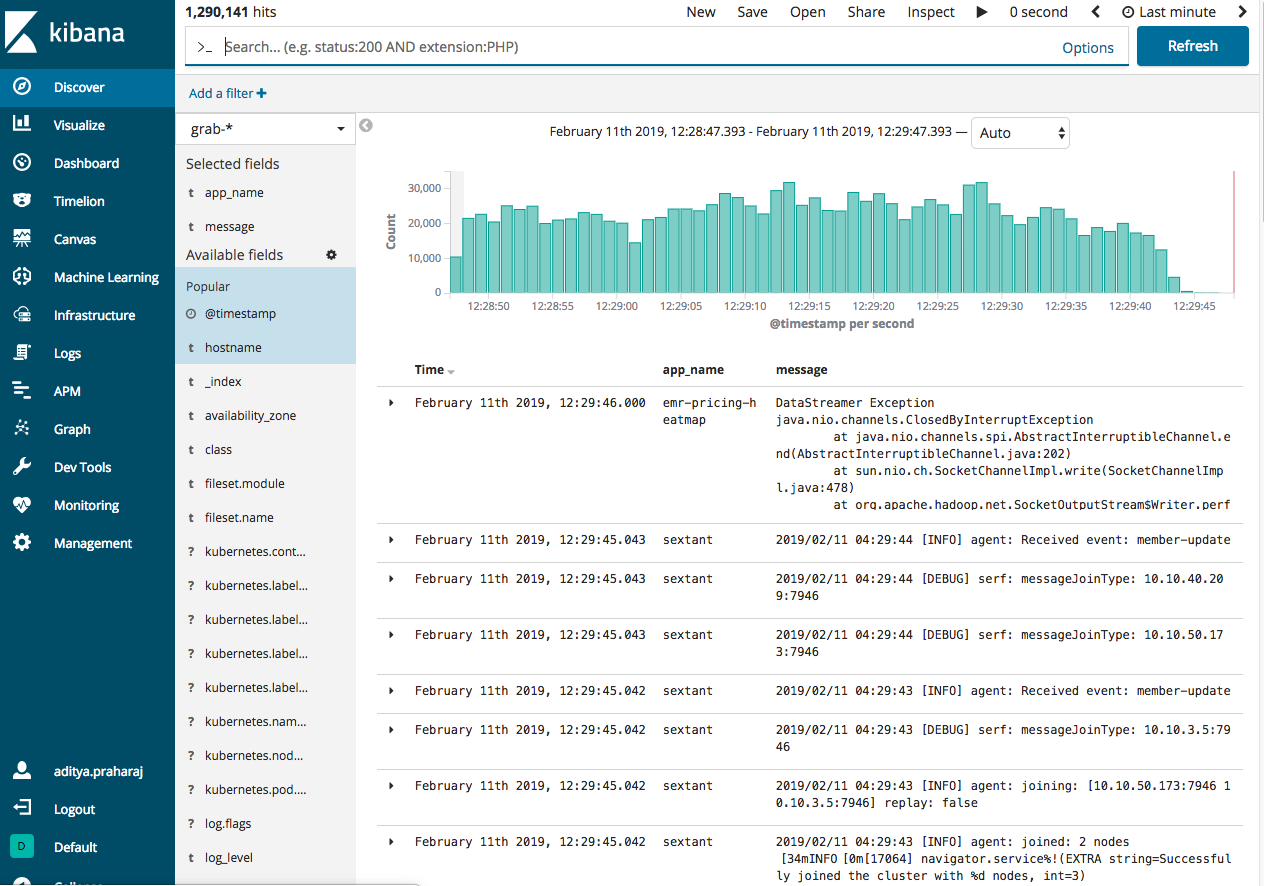 Figure 3: Production-like Logging Environment in Development
Causal Ordering
Having an exact history of events makes debugging issues in production systems easier - as one can just look at the history and quickly hypothesise what’s wrong and fix it. To this end, the structured logging library adds the exact write timestamp in nanoseconds in the logger. This combined with the structured JSON-like format makes it possible to sort all the logs by this field - so we can see logs in the exact order as they happened - achieving causal ordering in logs. This is an underplayed but highly powerful feature that makes debugging easier.
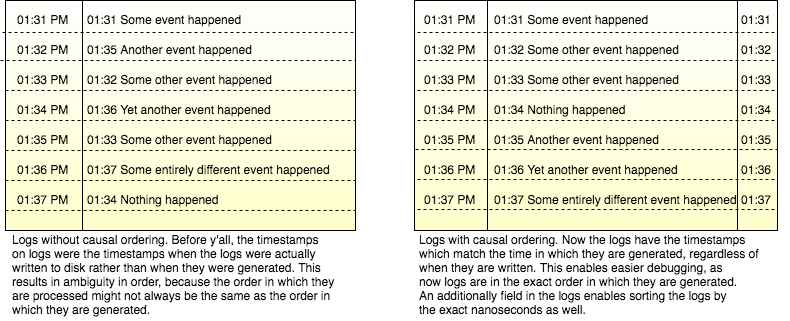 Figure 4: Causal ordering of logs with Y'ALL
But Why Structured Logging?
Now that you know about the history and the reasons behind our logging strategy, let’s discuss the benefits that you reap from it.
On the outset, having logs well-defined and structured (like JSON) has multiple benefits, including but not limited to:
- Better root cause analysis: With structured logs, we can ingest and perform more powerful queries which won’t be possible with simple unstructured logs. Developers can do more informative queries on finding the logs which are relevant to the situation. Not only this, log correlation and causal ordering make it possible to gain a better understanding of the distributed logs. Unlike unstructured data, where we are only limited to full-text or a handful of log types, structured logs take the possibility to a whole new level.
- More transparency or better observability: With structured logs, you increase the visibility of what is happening with your system - since now you can log information in a better, more expressive way. This enables you to have a more transparent view of what is happening in the system and makes your systems easier to maintain and debug over longer periods of time.
- Better consistency: With structured logs, you increase the structure present in your logs - and in turn, make your logs more consistent as the systems evolve. This allows us to index our logs in a system like Elastic stack more easily as we can be sure that we are sticking to some structure. Also with the adoption of a common schema, we can be rest assured that we are all using the same structure.
- Better standardisation: Having a single, well-defined, structured way to do logging allows us to standardise logging - which reduces cognitive overhead of figuring out what happened in systems via logs and allows easier adoption. Instead of going through 100 different types of logs, you instead would only have a single format. This is also one of the goals of the library - standardising the usage of the library across Golang backend services.
We get some additional benefits as well:
- Dynamic Log Levels: This allows us to have meaningful log levels in our code - where we can deploy with baseline warning settings and switch to lower levels (debug logs) only when we need them. This helps keep our logging costs low, as well as reduces the noise that developers usually need to go through when debugging.
- Future-proof Consistency in Logs: With the adoption of a common schema, we make sure that we stick with the same structure, even if say tomorrow our logging infrastructure changes - making us future-ready. Instead of manually specifying what to log, we can simply expose a function in our loggers.
- Production-Like Logging Environment in Development: The dockerised Kibana allows developers to enjoy the same benefits as the production Kibana. This also encourages developers to use Elastic stack more and explore its features such as building dashboards based on the log data, having better watchers, and so on.
I hope you have enjoyed this article and found it useful. Comments and corrections are always welcome.
Happy Logging!